

By Komson Silapachai, Vice President of Research & Portfolio Strategy
ESG investing has evolved from niche to mainstream, becoming one of the fastest-growing areas in investment management over the past two years. In the first quarter, ESG fund net inflows were at an all-time high, at $21.5 billion, according to Morningstar.
In the first three months of 2021, the U.S. sustainable fund landscape saw nearly $21.5 billion in net inflows. That’s more than the previous record for a quarter, $20.5 billion, set in the fourth quarter of 2020, and more than double the $10.4 billion seen one year ago in the first quarter of 2020. It was also about 5 times greater than first-quarter flows in 2019.
– Alyssa Stankiewicz, Morningstar Analyst, Sustainable Fund Flows Reach New Heights in 2021’s First Quarter
Given the positive change in investor sentiment toward values-based considerations, the wide range of strategies now available in the market, and the U.S. administration’s focus on climate issues, it is no surprise that the adoption of ESG investment strategies has increased. The burning question for investors continues to be, how did ESG-oriented segments of the market perform this year relative to their conventional counterparts? Below is the year-to-date performance through April 30 of some of the most followed ESG and conventional indexes.
Year-to-Date Returns Through April 30, 2021
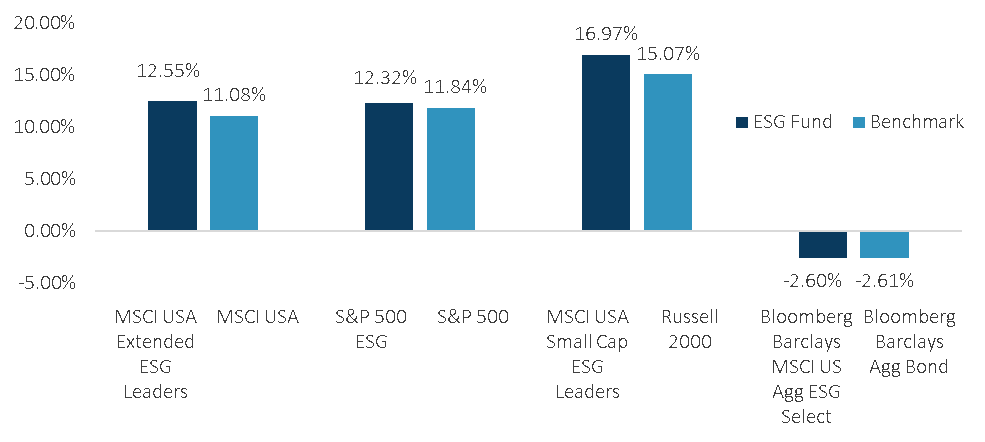
Source: Morningstar, Sage
The results from index returns show that in 2021, ESG investors have been rewarded across U.S. equities, both large and small cap, while fixed income largely tracked its conventional index. The biggest contributors to the outperformance within U.S. equities were the ESG strategies’ lower exposure to high-momentum stocks, which flatlined after a strong start to the year. The notion that sustainable investing means investors give up performance has proven to be false, and the marketplace has clearly taken notice with continued record inflows to start the year.
The Factor Lens – What is the Typical Company in an ESG Index?
One way to define ESG companies is to look at them through the lens of traditional investment factors. For investors constructing portfolios of funds, an awareness of the factor exposures helps to frame ESG indexes and companies in a useful light for positioning through a market cycle. In this section, we’ll examine two widely followed ESG ETFs: Xtrackers MSCI USA ESG Leaders (USSG) and the SPDR S&P 500 ESG (EFIV).
Using Bloomberg’s risk factor model, these ESG ETFs and the underlying companies would qualify as “high quality” based on the distribution of the fund’s factor exposure.
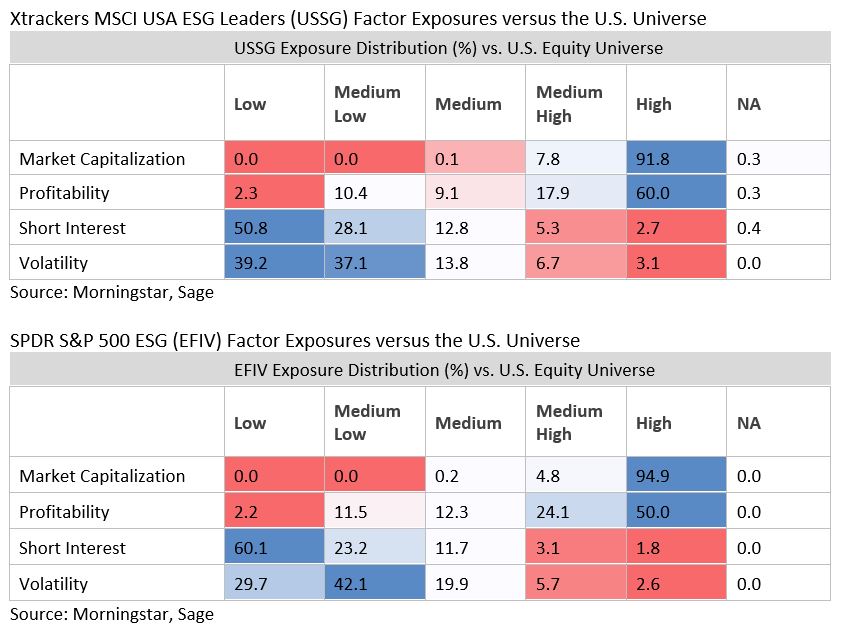
In the case of the above ETFs, the factor exposures of the names within the fund are mostly large capitalization companies with high profitability as defined by metrics such as profit margin and earnings variability, as well as low volatility. The results also make intuitive sense as larger companies that have consistent, largely predictable earnings and volatility could have more appetite to take on initiatives such as instituting ESG-friendly policies and disclosures.
One way we can utilize the factor exposure in portfolio construction is to gauge when ESG is likely to outperform during a business cycle. Typically, companies that have a high-quality profile outperform in the middle-to-late cycle, which makes ESG-oriented strategies compelling even through the first half of this year as the economic recovery matures into a late-stage growth phase.
When looking at the performance of ESG-oriented market segments thus far in 2021, along with changing investor preferences and a renewed focus on climate from the U.S. federal government, conditions still exist for ESG investing to grow well into the second half of the year and beyond.
Disclosures: This is for informational purposes only and is not intended as investment advice or an offer or solicitation with respect to the purchase or sale of any security, strategy or investment product. Although the statements of fact, information, charts, analysis and data in this report have been obtained from, and are based upon, sources Sage believes to be reliable, we do not guarantee their accuracy, and the underlying information, data, figures and publicly available information has not been verified or audited for accuracy or completeness by Sage. Additionally, we do not represent that the information, data, analysis and charts are accurate or complete, and as such should not be relied upon as such. All results included in this report constitute Sage’s opinions as of the date of this report and are subject to change without notice due to various factors, such as market conditions. Investors should make their own decisions on investment strategies based on their specific investment objectives and financial circumstances. All investments contain risk and may lose value. Past performance is not a guarantee of future results.
Sage Advisory Services, Ltd. Co. is a registered investment adviser that provides investment management services for a variety of institutions and high net worth individuals. For additional information on Sage and its investment management services, please view our web site at www.sageadvisory.com, or refer to our Form ADV, which is available upon request by calling 512.327.5530.