
US markets have experienced one of the greatest periods of performance relative to most broad asset classes over the last decade. Growth names that mostly reside in the top 100 US stocks (as they’ve road the momentum train all the way up the market cap list over the last 10 years) continue to push higher in a market that feels expensive but by traditional ratios is just slightly above normal levels. What are we missing? We are missing any real sense of expected growth over the next 3 to 5 years. More on that to come.
There are 4, trillion-dollar, publicly listed US companies. Just how much of the global equity rally are Microsoft, Apple, Alphabet (Google) and Amazon, also known as MAGA, responsible for? In terms of contribution to return, between March 31st 2009 and Dec 31st 2019, MAGA was responsible for 1/8th (12.4%) of the entire US market rally measured by iShares S&P Total Market ETF (ITOT). MAGA also contributed nearly (13.64%) to the S&P 500 measured by SPDR S&P 500 ETF Trust (SPY) and more than 1/12th of global equities rally compared to iShares TR/MSCI ACWI ETF (ACWI) (more to come). We’ll focus on the US total market comparison, which holds approximately 1500 companies in addition to owning over 5000 individual tickers since March 2009. Very few of them mattered except for the ones that now reside at or near the top of the index. Below you will find a contribution to return chart. We will refer to these as CTR.

• Over that period ITOT grew 369.7% (a CTR of 3.7 or higher was 1% of total growth)
• iShares MSCI ACWI ex US ETF (ACWX) returned 194.7%
• There were 79 Stocks that added a CTR greater than 1 to ITOT, 1 CTR representing 0.27% of growth over that period • MAGA had a combined CTR of 45.7, 12.4% of ITOT’s total growth (or approximately, 1/8th)
• How quickly do you get to 50% CTR? 66 stocks. Accounting for 185.5% of ITOT’s 369.7% returns, the top 4 (MAGA) accounted for 12.4% on their own, so 5 to 66 was an additional 37.5%.

To understand the dominance that US stocks have had against their international counterparts, the next study we ran was on iShares MSCI ACWI ETF (ACWI). ACWI was launched on 4/22/09 and the data runs through 12/31/2019, so a few weeks shy of identical time period to above.
• Over that time period, ACWI grew 242%.
• 3,315 names have been in ACWI, and the top 45 (1.36%) make up 30% of its growth (72.5/242)
• 38 of the 45 (84.4%) stocks were listed in the US, 7 internationally (listed above with CTR rank)
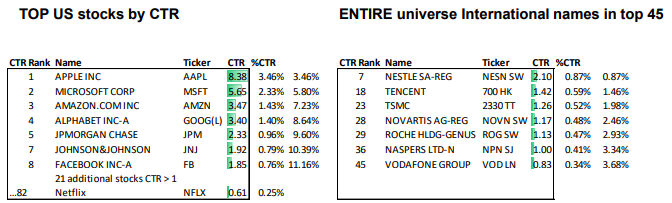
CTR return for those 7 international names was 8.9 (of 242%). Apple was 8.4, and MAGA overall came in at 20.9, about 8.5% of the entire global rally (or more than 1/12th).
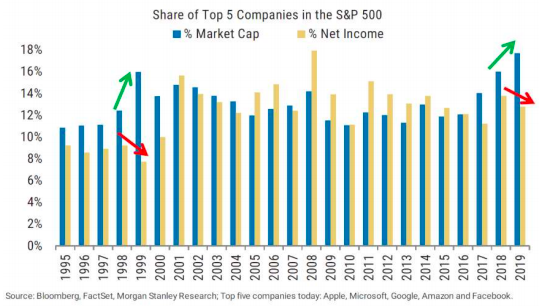
Its effects on the stability of an economy can be seen below as competitive disadvantages for the have-nots add up and hurt overall margins.
So why do stocks feel so much more expensive than they appear?

Future growth expectations have plummeted. Above, you will see a PEG ratio chart of the S&P 500 hitting its all-time high. PEG ratio is a way of pricing P/E in relation to future growth. Typically, higher risk investments have higher P/E, but also higher expected growth rates. PEG ratio is a good way to compare two investments with different levels of risk and rationalize the difference in fundamentals. After a decade of dominance, we have exhausted all expectations for significant growth in the US. In this case, the median Wall Street consensus on earnings growth has plummeted.
Balanced portfolio expectations out of wack
You can see this in Wall Street capital market assumptions, which sometimes expect US equities to grow just 5-6% per year over the next 5 years. Let’s say you can reasonably expect 2.5% yield on a bond portfolio. A balanced portfolio of 50% stocks and 50% bonds will return 3.5 to 4% per year if rates stay steady. Not exactly what clients are expecting, or what they have grown used to over the last 10 years.
2019 – multiple expansion, buybacks, labor tightness, and the QE twist!
Most returns in global equities came by way of margin expansion. The US unemployment rate sits at 3.6%. With birth rates slowing and immigration tightening, we think unemployment has created somewhat of an artificial choke on the market as companies seek to staff up. The long awaited global Quantitative Easing drawdown was short lived! QE is back in action, regardless of what the Fed is calling it.
2020 Expectations
• The good, the bad, and in the end, likely the mediocre. Volatility will come in waves, but all in all the year may end up with not much changed on broad equity markets for 2020.
• The Fed – chasing an inflation target it can’t achieve? QE will be bountiful when needed in a politically pressurized year.
• US markets will go by way of their margins. We’ve mentioned the never ending margin expansion that finally retracted in 2019. Margins on the S&P 500 are still near all time highs, and a tick up or down may dictate where US equities end up for 2020.
• 2020 will be the time to think beyond traditional indexes, market caps, sectors and geographic regions for both equity and bond investments.
• 2020 will be another big year for thematic ETFs. Thematic ETFs are inherently more volatile than broader indexes but offer access to more thinly sliced pockets of growth.
• Parts of the high yield market will begin to chip into concentrated sectors such as energy.
• Baring a global pandemic, there is value in emerging market equities (outside of a few state owned enterprises).
• Trade tensions were a benefit to US equities relative to other markets more dependent on exports, the removal of trade concerns should benefit exporters, in international markets.
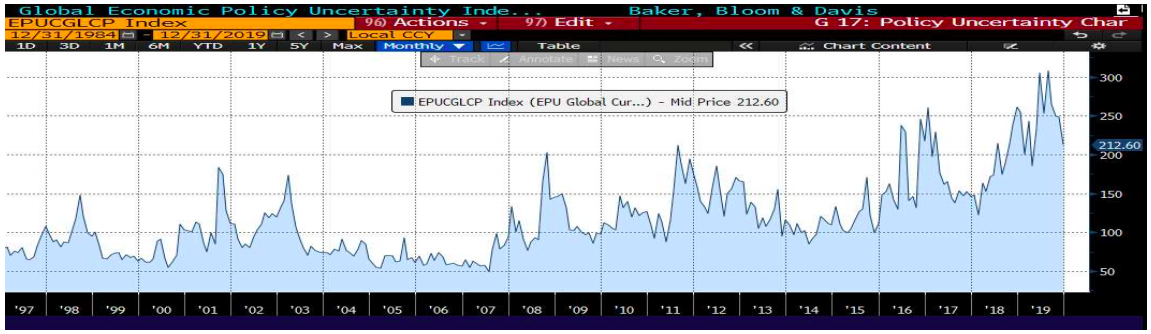
• This all assumes global policy uncertainty continues to drop.
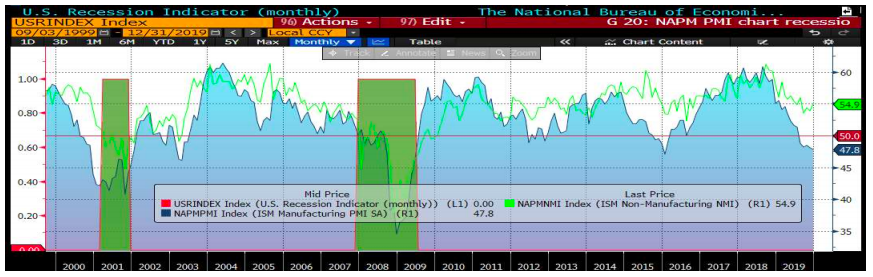
We continue to monitor traditional metrics for potential market dislocations, such as widening credit spreads & invested yield curves. High yield credit spreads in the energy sector have begun to move, but overall we’re less confident that we can derive clear signals from traditional fixed income signals in the world of quantitative easing (compared to historical results). Consumer spending has begun to soften and PMI is still below 50 at the moment. Trade war fears have passed & Brexit is underway. We do not claim to understand the full economic implications of the Coronavirus outbreak, but will continue to monitor and provide updates as its effects become more clear.
The fact that the MAGA stocks are gaining more and more size in the market does not mean the market is set for an immediate crash due to this fact alone. It more clearly shows us exactly what QE has done. Those with the strongest balance sheets, and best growth stories, weather countries companies or individuals (see last commentary for reference to Sapiens) expand and are given limitless access to credit for whatever they choose to invest in.
US Equities
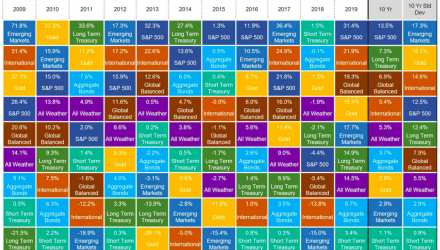
iShares Core S&P 500 ETF (IVV) returned 31.44% for the year, mainly attributed to margin expansion. Mid and small caps trailed returning 26% and 22.7% respectively. Value and growth came in line with each other, although January was a pretty terrible month for value investors. Despite losing ground to momentum in the 4th quarter (which returned a staggering 9%, 3% greater than all other factors), it was actually the quality factor that outperformed most, returning 34% year to date. Dividend strategies underperformed.
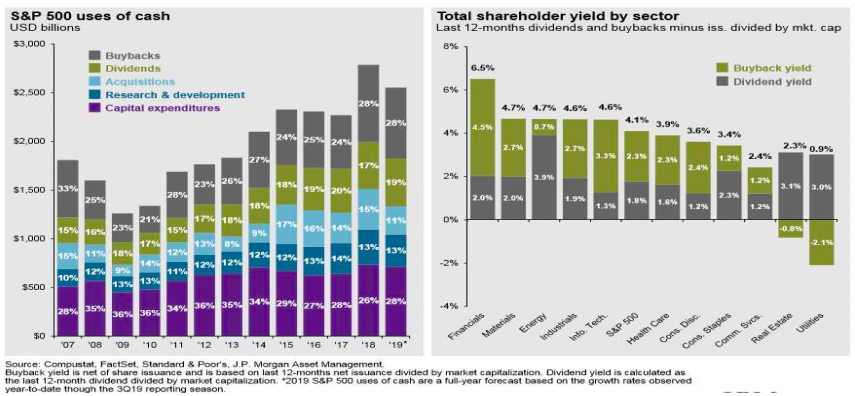
Tracking Buybacks is an active part of our macroeconomic decision making process, unfortunately. We much prefer investing based on the potential of the actual underlying business / sector / theme. But as you can see above, buybacks are just too big to ignore. JP Morgan put together a shareholder yield by sector chart (not to be confused with shareholder yield terms Toroso has previously discussed), looking at “real” returns of a company removing buybacks. This chart shows the combination of buyback and dividend yield – 75% of the expected “total shareholder yield” for financials came from buybacks. Just because you don’t like it doesn’t mean you can ignore it.
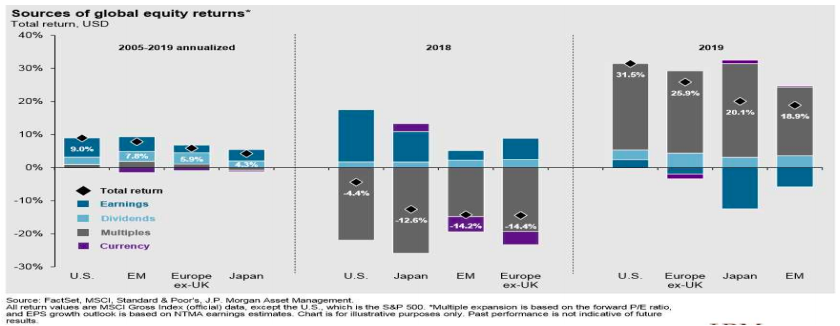
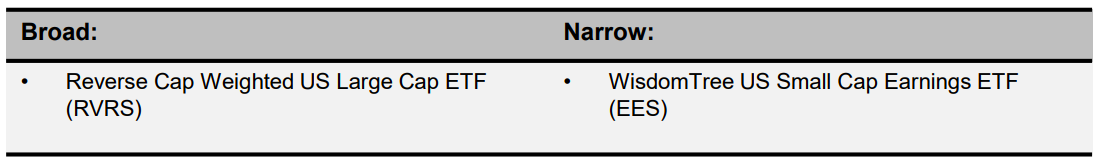
2019 was very much in line with the old Wall Street saying, “climbing the wall of worry.” Constant news cycles of global events with potential for serious market dislocations, a constant drip of buybacks, QE return and margin expansion. The chart above can show you just how much of last years rally was attributed to margin expansion. We continue to favor non-traditional weighting methodologies such as Reverse Cap Weighted US Large Cap ETF (RVRS), and have recently added to small cap value through the WisdomTree US Small Cap Earnings ETF (EES) and other global thematic ETFs that will be reviewed further on in this commentary.
International Equities
International Developed Equities continue to appear cheap with minimal growth prospects. It’s hard to get excited about a fundamental play in Nestle. With Brexit in the window there is reason for optimism, but broader indexes will likely continue to disappoint. We continue to access this asset class through thematic ETFs with allocation in the region or active managers with high active-share. iShares MSCI EAFE ETF (EFA) returned 2.17% for the quarter and ended the year up 21.94%.
Emerging Markets
iShares MSCI Emerging Markets ETF (EEM) was up 2.13% for the quarter, up 17.67% for 2019. Trade tensions are in the past for now. Earnings season thus far has shown us that the effects were not as bad as anticipated (Apple’s sales in China were strong). Coronavirus aside, there is value to be found here. Below you will find a tool we built looking at Ownership & Governance within emerging market equities. The left represents EMQQ and the right EEM. The grey represents state owned enterprises, yellow is foreign ex state owned enterprises (ex-SOE), and the blues are ADRs and US listed stocks.
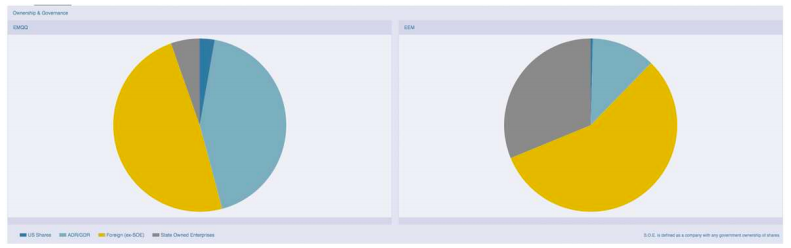
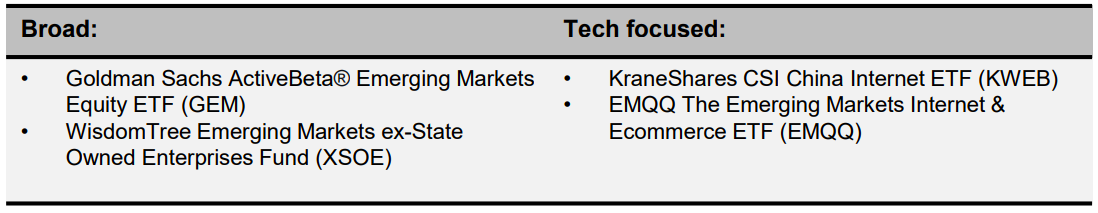
The massive state owned exposure in broad emerging market indexes are sucking the growth potential out of emerging market equity investments. These are not the exciting growth companies accessing the thriving category that is the emerging market consumer. We continue to favor the EMQQ The Emerging Markets Internet & Ecommerce ETF (EMQQ), which returned 9.68% in the 4th quarter and was up 32.7% for 2019. Despite this rally, these stocks have a PEG ratio just above 1, compared to much higher levels on US stocks.
Something we are confident in predicting
At least one of Tencent or Alibaba will be bigger than one of the MAGA stocks within 5 years • Tencent (700 HK) has a market cap of approximately $480 billion • Alibaba (BABA US) has a market cap of approximately $571 billion It’s unlikely all 4 MAGA stocks will remain in the trillion dollar group, but to show how much Tencent and Alibaba would have to rise to meet MAGA at the trillion dollar mark; Alibaba would have to grow 11.8% per year, and Tencent would have to grow about 15.65% per year. Remember, we started this commentary by discussing the LACK of future growth prospects.
Fixed Income
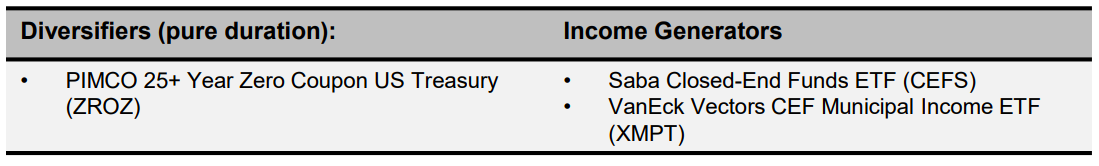
The iShares Core US Aggregate Bond ETF (AGG) returned 1.79% for the quarter and 8.86% for 2019. Without a significant market pullback or deflation, we fear that this is not something likely to repeat in 2020. Duration was king and credit spreads remained exceptionally tight. We continue to recommend a barbell approach to this space, and we would go as far as saying you should barbell your barbell. We have continued to separate our duration from credit risk, using unique ways to capture yield in vehicles such as Saba’s Closed-End Funds ETF (CEFS), paired with high duration from PIMCO 25+ Year Zero Coupon US Treasury ETF (ZROZ). CEFS was up 5.39% in the 4th quarter and up 29.03% in 2019 after a volatile 2018. Active rebalancing between these trading vehicles and cash-like and core fixed income investments is key.
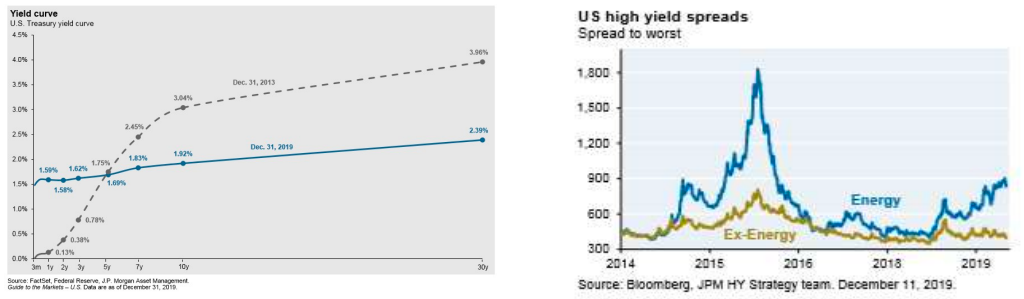
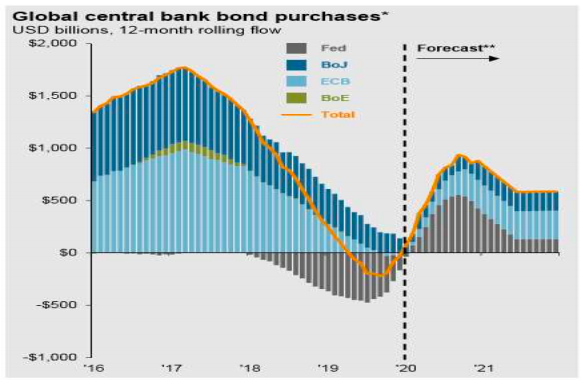
The chart above on the left gives you an idea of what longer-term Quantitative Easing does to markets. This is not going away anytime soon. While the amount of negative yielding debt has come down a bit from highs in the last 6 months, we do not think we’ve seen its peak yet. The developed word is aging and hungry for yield. The chart on the right shows how tight most high yield spreads are, but interestingly enough, the energy sector seems to be showing some cracks. We will continue to monitor this closely.
Alternatives
SPDR GoldShares ETF (GLD) returned 4.74% for the 4th quarter, returning 18.36% for 2019. The Bloomberg Galaxy Crypto Index (BGCI) returned 7% for the year, while bitcoin quietly returned 95%. AGFiQ Market Neutral Anti-Beta ETF (BTAL) returned 1.06% for the year, which is impressive considering its strong down capture ratio to equities.
Source: Morningstar Direct. Data as of December 31, 2019
Conclusion
We continue to recommend a barbell approach to risks within asset classes (think equities and fixed income), and for the entire portfolio. The names below are definitely more volatile than traditional broad indexes, but we see more and more value in seeking the non-traditional in these markets. High active Share ETFs to consider with a decrease in overall portfolio risk weighting:
• Davis Select Worldwide (DWLD)
• Robo Global Robotics & Automation (ROBO)
• ARK Genomic Revolution (ARKG)
• The Emerging Markets Internet & Ecommerce ETF (EMQQ)
It feels great to see the US markets dominate and many investors are overweighted where the market strength has shown. A decade of winning has become self-fulfilling, but our feelings about price and the momentum train continues to make us leery that the next decade will need to find new winners. At times of potential market dislocations, it is important to review larger assumed structures in society deemed common though. In the lead up the last US recession, a record setting 10+ years ago, markets underpriced the likelihood of a system wide housing decline causing all sorts of havoc to financial markets. If it feels like we are in a market that can’t go down, its often because the tools have only become that much more complex.
An example of this can be seen in the New York City real estate market. High end luxury real estate in New York has taken a hit for sure; nothing of any real significance. There are thousands of unsold luxury condos on the Island of Manhattan. A vast majority of them have not been listed, and are currently being financed by the hedge fund world through inventory loans. Quantitative Easing lowers rates, hedge funds lever up & lend. At the end of the day, it still comes down to supply and demand. The Federal Reserve, through quantitative easing allows easy access to capital for large publicly traded organizations who have chosen to use their cash not for R&D but to purchase back their stock, often daily, leaving a constant drip of buying. In the public markets cheap access to capital created an auto buyer (demand), and in New York real estate inventory financing has suppressed the size of the market offering. We are still an over in debt nation we just have found more creative ways to stuff the turkey.
Disclaimer: This commentary is distributed for informational and educational purposes only and is not intended to constitute legal, tax, accounting or investment advice. Nothing in this commentary constitutes an offer to sell or a solicitation of an offer to buy any security or service and any securities discussed are presented for illustration purposes only. It should not be assumed that any securities discussed herein were or will prove to be profitable, or that investment recommendations made by Toroso Investments, LLC will be profitable or will equal the investment performance of any securities discussed. Furthermore, investments or strategies discussed may not be suitable for all investors and nothing herein should be considered a recommendation to purchase or sell any particular security. Investors should make their own investment decisions based on their specific investment objectives and financial circumstances and are encouraged to seek professional advice before making any decisions. While Toroso Investments, LLC has gathered the information presented from sources that it believes to be reliable, Toroso cannot guarantee the accuracy or completeness of the information presented and the information presented should not be relied upon as such. Any opinions expressed in this commentary are Toroso’s current opinions and do not reflect the opinions of any affiliates. Furthermore, all opinions are current only as of the time made and are subject to change without notice. Toroso does not have any obligation to provide revised opinions in the event of changed circumstances. All investment strategies and investments involve risk of loss and nothing within this commentary should be construed as a guarantee of any specific outcome or profit. Securities discussed in this commentary and the accompanying charts, if any, were selected for presentation because they serve as relevant examples of the respective points being made throughout the commentary. Some, but not all, of the securities presented are currently or were previously held in advisory client accounts of Toroso and the securities presented do not represent all of the securities previously or currently purchased, sold or recommended to Toroso’s advisory clients. Upon request, Toroso will furnish a list of all recommendations made by Toroso within the immediately preceding period of one year.