
Municipal bonds are known for their tax advantages and low default rates¹. Right now they have a lot to offer investors. However, that particular slice of the market is also quite complex due to the number of securities and issuers in the space representing myriad municipalities. The fact that the U.S. is in an election year further complicates the outlook. Given these factors, an actively managed approach seems a logical way to access the space.
Data as of 3/31/2024.
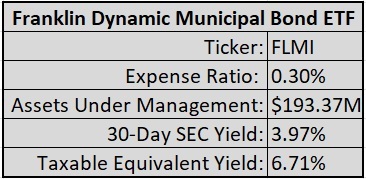
Franklin Templeton is uniquely situated to provide such an investment solution largely due to its vast research experience in the municipal bond space, which it has distilled into the Franklin Dynamic Municipal Bond ETF (FLMI), an active fund that leverages the best ideas of Franklin’s municipal bonds research group – available for an expense ratio of 30 basis points.
Optimism Around Municipal Bonds
Muni bonds currently offer attractive yields and credit spreads for investors.
A research note published by Franklin in January cited a “favorable backdrop” paired with “strong credit fundamentals” as reasons to be optimistic about the municipal space, with bonds overall set to benefit from expected monetary easing and falling yields. In particular, Franklin’s muni analysts highlighted state general obligation bonds, land-secured bonds, and charter-school bonds as sectors within the municipal bond category to watch.
According to Benjamin Barber, director of Franklin Templeton Fixed Income – Municipal Bonds and one of FLMI’s portfolio managers, three months into the year, conditions are good for municipal bonds.
“We believe we’re getting paid too much additional yield, for the incremental credit risk we’re actually taking. That’s a good trade-off for us,” he said.
Barber further noted that the tax-adjusted yields for municipal debt look very attractive relative to corporate and sovereign bonds and Treasuries.
Municipal Bonds A Complicated Category
The U.S. municipal bond market sits at around $4 trillion in terms of size spread across roughly 1 million securities issued by about 50,000 state and local governments, according to the Municipal Securities Rulemaking Board. That’s less than one-tenth of the total size of the more than $50 trillion U.S. bond market.
Consider that the U.S. stock market had roughly 3,500 securities at the end of 2023, according to Wilshire. Publicly traded companies tend to be very transparent. They publish regular reports, meet with analysts, and generally keep the public apprised of what’s going on with their activities. The state and local government entities that issue municipal debt are equally transparent if you know where to look. However, individual municipalities usually are not widely covered by analysts in the way that many companies are. That means navigating the space can be tricky.
Plenty of passively managed municipal bond ETFs are out there. The largest two represent more than $65 billion in assets under management combined. However, the muni bond market’s passively managed funds generally cover broad swaths of their designated asset classes that meet the selection criteria. Because of the nature of indexes, it’s impossible to move quickly to evict an underperforming issue from a portfolio until the next rebalance. Even then, depending on the methodology, the undesirable security can still find its way into a fund’s holdings. However, an actively managed fund can make those changes immediately when the manager deems them necessary.
Portfolio Managers With an Edge
FLMI’s managers partner with the firm’s muni research team to winnow at the vast universe of municipal debt securities, seek out relative value opportunities, manage risks, and allocate among sectors within munis And while its two largest passively managed competitors hold between 5,000 and 10,000 securities, FLMI’s portfolio has fewer than 500 holdings, all selected for their potential to outperform.
The managers weigh the fund’s positions based on their level of conviction. However, Barber indicated that the team is wary of crossing the line from conviction into prognostication.
“[FLMI] seeks to take advantage of whatever we’re seeing in the municipal market, from the two main angles of risk in fixed income. One is duration, just straight volatility, and the other is credit risk. The idea with this fund is we can move both of those levers up and down, depending on our views,” Barber said.
He noted that his group doesn’t use derivatives in its muni strategies.
“It’s around the margin that we’re going to make our calls. We want to have a strategy that we can ride out a whole cycle of whether it’s a rate cycle or a credit cycle,” Barber added. He also noted the strategies tend to be consistent over longer periods rather than making abrupt changes.
He described FLMI as a “core plus” type of fund within the muni space. Barber also stated how, despite its prospectus outlining a two to eight-year duration range, the fund generally sits at three to six years in duration. The fund’s duration as of the end of Q1 2024 was 5.42 years. Historically, the fund’s lowest duration was 3.39, while its highest was 6.91.
In terms of credit quality, FLMI can move up to 40% of its portfolio into high-yield securities if conditions dictate such an action. Barber noted that as of the end of the first quarter, the fund was nearly at that limit, at 36%.
An Active ETF Powered by Rigorous Research
Franklin’s municipal bond group includes 34 individuals split evenly between research analysts and portfolio managers or traders. The team is spread across the country. This allows for analysis powered by “boots on the ground” research when needed. The group also leverages its capacity for fundamental credit research as part of its rigorous evaluation approach.
Barber said that the team focuses heavily on the credit side. However, they also delve deep into the macro data to understand which areas of the muni space are attractive. From there, the team relies on bottom-up research to analyze individual securities.
The muni group works closely with investment bankers and other clients to advise them on how to structure deals for municipal projects and initiatives, Barber said. This paints a picture of a highly collaborative and debate-filled process.
An individual analyst will do a deep dive into the project in question. This takes into account financial, legal, and demographic data, before presenting their findings to the credit committee. And that includes both analysts and portfolio managers, for the committee to decide on the deal. Barber described these discussions as “very inclusive and intense.”
“We’re paid to disagree with each other to try to get to the best answer at the end of the day,” he said.
This year also features key elections at the national and state levels. Barber pointed out that at the national level, in terms of creating a stable investment environment, a divided government is preferable. It is more likely to maintain the status quo that way. However, for municipal bonds in particular, a unified state or local government has more ability to move forward with project goals. That makes it more likely to issue municipal debt to fund those projects.
FLMI’s Success Is No Fluke
With an active and selective strategy driven by the best ideas of a large team of experts, it’s not surprising that FLMI has demonstrated strong income and total returns:
- 30-day SEC Yield of 3.97% and tax-equivalent yield of 6.71%²
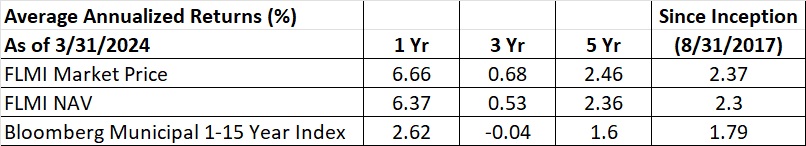
- Annualized excess returns vs benchmark for 1-year, 3-year, 5-year, and since FLMI inception periods.
Franklin Dynamic Municipal Bond ETF (FLMI) Vs. Bloomberg Municipal 1-15 Year Index
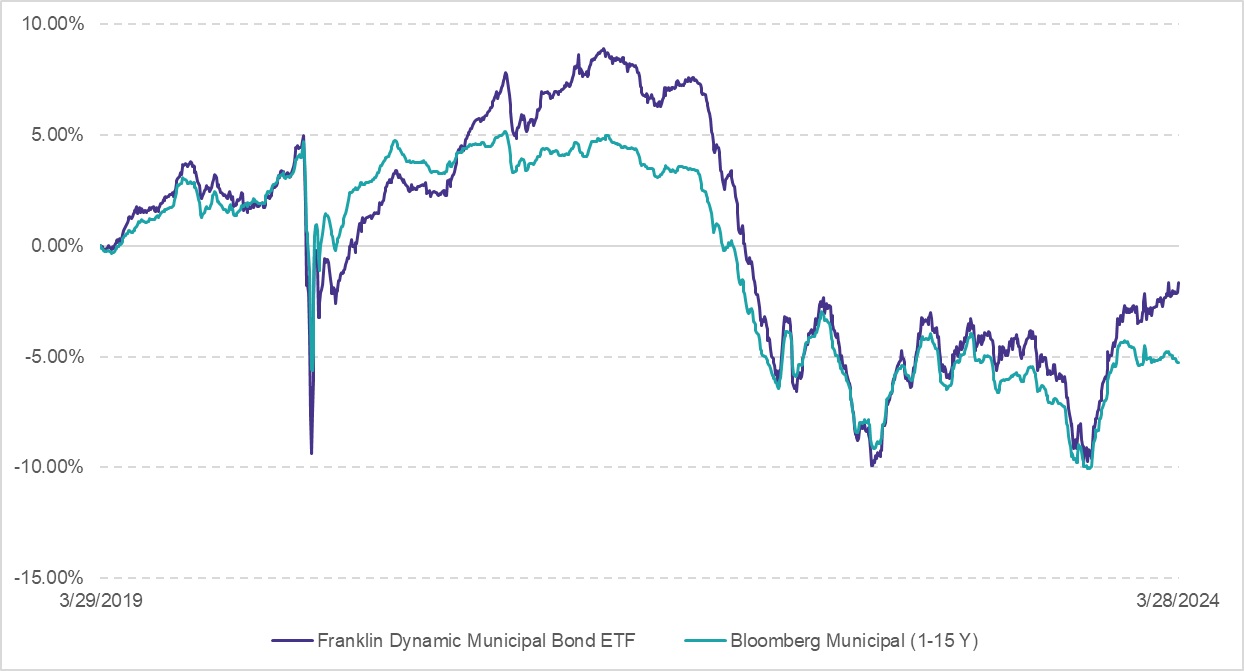
Source: FactSet, 03/29/2019-03/29/2024
Performance data quoted represents past performance, which does not guarantee future results. Current performance may be lower or higher than the figures shown. Principal value and investment returns will fluctuate, and investors’ shares, when redeemed, may be worth more or less than the original cost. Performance would have been lower if fees had not been waived in various periods. Total returns assume the reinvestment of all distributions and the deduction of all fund expenses. An investor cannot invest directly in an index, and unmanaged index returns do not reflect any fees, expense, or sales charges. Returns for periods of less than one year are not annualized. For current month-end performance, please call Franklin Templeton at (800) DIAL BEN/(800) 342-5236 or visit www.franklintempleton.com.
Net Asset Value (NAV) returns are based on the NAV of the ETF; Market Price returns are based upon the official closing price of the ETF’s shares. Returns are average annualized total returns, except for those periods of less than one year, which are cumulative. Market Price returns are calculated using the closing price as of 1 p.m. Pacific time on each trading day (when NAV is normally determined for most funds), and do not represent the returns you would receive if you traded shares at other times. Since shares of the Fund did not trade in the secondary market until after the Fund’s inception, for the period from inception to the first day of secondary trading September 5, 2017, the NAV of the Fund is used as a proxy for the Market Price to calculate market returns.
For more news, information, and analysis, visit VettaFi | ETF Trends.
Footnotes:
¹ Source: https://www.msrb.org/sites/default/files/2022-09/MSRB-Muni-Facts.pdf
² Data as of 3/31/2024. The 30-day SEC yield is calculated using the net income (interest and dividends) per share earned over a trailing 30-day period (annualized), divided by the fund’s share price at the end of that period. It may not equal the fund’s actual income distribution rate, which reflects the fund’s past dividends paid to shareholders. Taxable Equivalent Yield: Assumes the maximum regular federal income tax rate, maximum state personal income tax, and Medicare tax in effect on December 2023.
IMPORTANT INFORMATION
All investments involve risks, including possible loss of principal. Fixed income securities involve interest rate, credit, inflation and reinvestment risks, and possible loss of principal. As interest rates rise, the value of fixed income securities falls. Low-rated, high-yield bonds are subject to greater price volatility, illiquidity and possibility of default. Changes in the credit rating of a bond, or in the credit rating or financial strength of a bond’s issuer, insurer or guarantor, may affect the bond’s value. Unrated debt securities have less public information and independent credit analysis and they may be subject to a greater risk of illiquidity, price changes or default. These and other risks are discussed in the fund’s prospectus.
ETFs trade like stocks, fluctuate in market value and may trade at prices above or below their net asset value. Brokerage commissions and ETF expenses will reduce returns. ETF shares may be bought or sold throughout the day at their market price (MP), not their Net Asset Value (NAV), on the exchange on which they are listed. Shares of ETFs are tradable on secondary markets and may trade either at a premium or a discount to their NAV on the secondary market.
Carefully consider a fund’s investment objectives, risks, charges and expenses before investing. Please view the prospectus or summary prospectus for this and other information. Read it carefully.
2024 Franklin Distributors, LLC Member FINRA/SIPC. All rights reserved.