

Factor investing allows for targeted equity exposure for those seeking specific investment outcomes. For example, factors may be used to enhance a portfolio’s risk and return profile or help generate income. Multifactor strategies could potentially prove advantageous for investors, blending multiple benefits within a singular fund. Advisors and investors looking for alpha potential may want to consider the Fidelity Multifactor ETF lineup.
Fidelity’s Multifactor ETF suite combines exposure to four factors within a single strategy. Companies included within each Fidelity Multifactor Index demonstrate a high level of quality alongside attractive valuations. They also exhibit positive momentum signals and relatively lower volatility than the broader market.
By combining cyclical, return-seeking factors (value and momentum) with generally defensive oriented factors (quality and low volatility), this leads to a balanced portfolio of stocks with exposure to four factors associated with historical long-term outperformance.
- Fidelity defines a quality company as demonstrating profitability through its free cash flow margin and stability. It also includes the return on invested capital.
- When evaluating value, Fidelity includes free cash flow yield, forward-looking earnings estimates relative to price, the tangible book value to price, and the EBITDA to enterprise value ratio.
- The momentum factor analyzes each company’s 12-month return minus its most recent month’s return. It also includes a similar measurement that adjusts for the stock’s volatility.
- The low volatility factor screens companies based on their 5-year beta and standard deviation of price returns. It also includes the 5-year standard deviation on earnings-per-share.
Within each sector, companies are scored on their combined exposure to these factors for an apples-to-apples comparison. The top-ranking stocks within each sector will typically be selected by the index.
A Balanced U.S. Equity Exposure With Alpha Potential
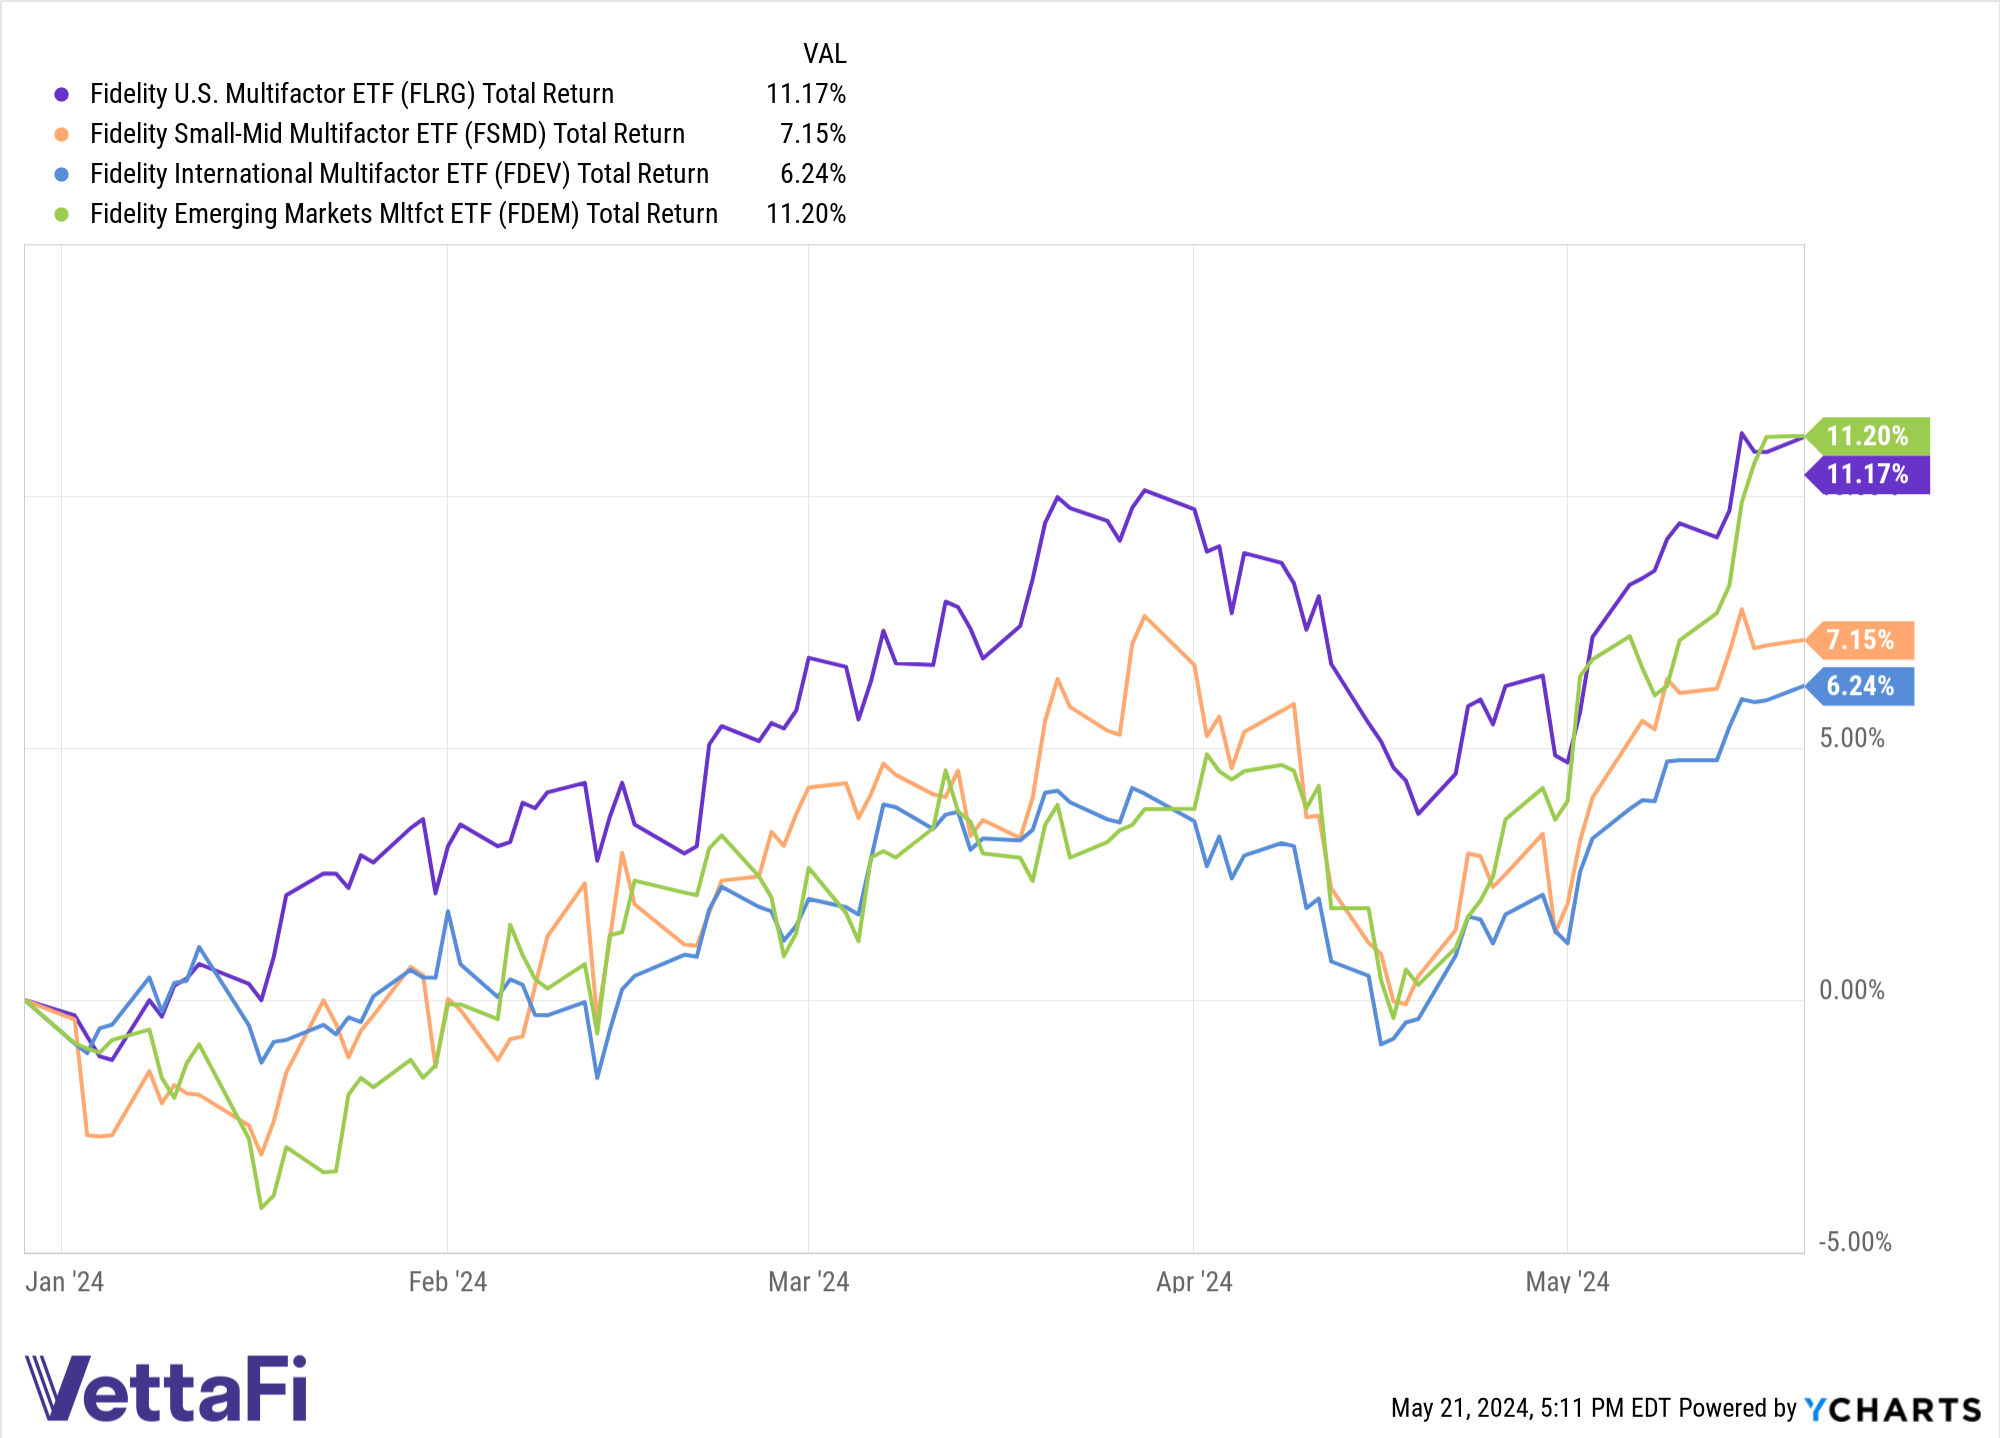
Data as of 05/20/2024.
Fidelity currently offers two different multifactor ETFs for those seeking exposure to U.S. equities.
The Fidelity U.S. Multifactor ETF (FLRG) provides exposure to large-cap U.S. companies that demonstrate quality, value, low volatility, and momentum factors. The fund seeks to track the Fidelity U.S. Multifactor Index ℠. The Index selects stocks from the top 1000 U.S. companies by their float-adjusted market capitalization.
At each Index rebalance, the sector weights are adjusted to neutral. This allows the strategy to avoid taking on unintended sector bets. FLRG had 105 holdings as of 04/30/2024 with an expense ratio of 0.15%.
The Fidelity Small-Mid Multifactor ETF (FSMD) provides exposure to U.S. small- and mid-cap companies that score highly on the same four factors. The fund seeks to track the Fidelity Small-Mid Multifactor Index℠. The Index selects stocks from the top 3,000 U.S. companies minus the top 500 based on float-adjusted market capitalization.
Similar to FLRG, the sector weights adjusted to neutral at each Index rebalance. FSMD had 600 holdings as of 04/30/2024 with an expense ratio of 0.15%.
International Multifactor Investing With Fidelity
The Fidelity International Multifactor ETF (FDEV) provides factor-based exposure to developed markets and international equities. The fund seeks to track the Fidelity International Multifactor Index℠. The Index selects stocks from the top 1,000 developed international companies by float-adjusted market capitalization. When the Index rebalances, it reallocates 25% of the portfolio to sectors that are the least correlated to the S&P 500. FDEV had 228 holdings as of 04/30/2024, with an expense ratio of 0.18%.
The Fidelity Emerging Markets Multifactor ETF (FDEM) provides exposure to emerging market companies that exhibit quality, low volatility, momentum, and value. FDEM seeks to track the Fidelity Emerging Markets Multifactor Index℠. The Index selects stocks from the top 1,000 EM companies by float-adjusted market cap. When the Index rebalances, it reallocates 25% of the portfolio to sectors that are the least correlated to the S&P 500. FDEM carried 236 holdings as of 04/30/2024 with an expense ratio of 0.25%.
For more news, information, and strategy, visit the ETF Investing Channel.
Fidelity Investments® is an independent company, unaffiliated with VettaFi. There is no form of legal partnership, agency affiliation, or similar relationship between VettaFi and Fidelity Investments. Nor is such a relationship created or implied by the information herein. Fidelity Investments has not been involved with the preparation of the content supplied by VettaFi. It does not guarantee, or assume any responsibility for its content.
1149870.1.0