

The current speculative environment seems to increasingly resemble the Technology Bubble of 1999/2000. Leadership is narrow, valuation dispersions are massive, relative strength and momentum are the primary drivers of performance, and investors are shunning diversification to take impulsive near-record portfolio risk.
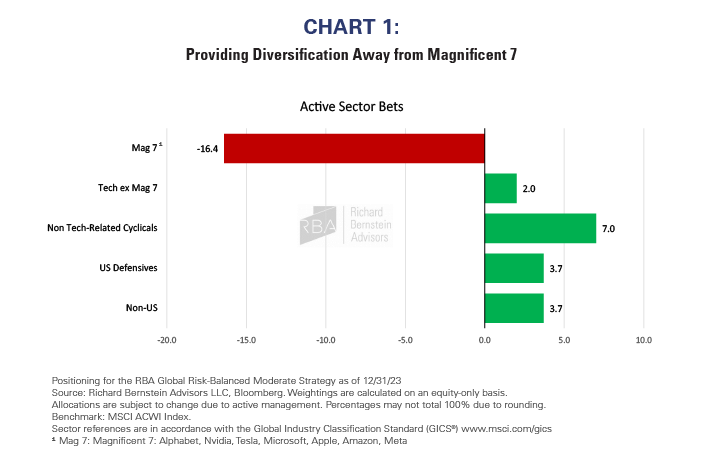
Today’s consensus remains focused on the Magnificent 71 stocks, but no sound financial theory counsels that seven stocks constitute a well-diversified portfolio as a core for building wealth. The possibility of another lost decade in equities and the broad range of investment opportunities outside the Magnificent 7 leads us to position our portfolios with significant diversification (See Chart 1).
1999/2000 bubble formation
The combination of the excitement of new internet technology changing the economy and considerable central bank liquidity that couldn’t be fully absorbed by the real economy helped fuel the 1999/2000 Tech Bubble.
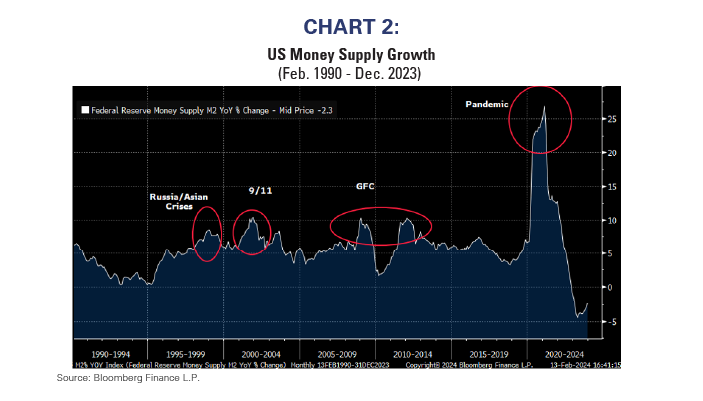
Despite consistently strong US GDP growth between 3.5% and 6.5%, the Fed eased in 1997/98 because of several emerging market financial crises (mainly the Russian Ruble and Asian crises and the collapse of Long-Term Capital Management). US M2 money supply growth rose to nearly 8%, but the economy was already healthy and couldn’t absorb the excess liquidity. The excess liquidity acted as a stimulant for the Tech Bubble.
While it’s true that US money growth was higher following 9/11, the global financial crisis, and the COVID pandemic, 1998’s liquidity infusion wasn’t associated with a falloff in economic activity, so excess liquidity flowed to financial assets rather than to rebuilding the economy (see Chart 2).
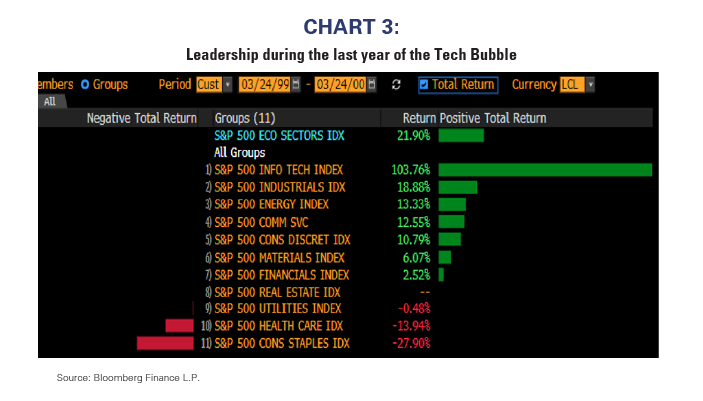
There was very narrow leadership during the Tech Bubble as only a few sectors were considered part of the “new economy” (stocks related to the potential growth of the internet). Traditional businesses, termed “old economy” stocks, significantly underperformed. Chart 3 highlights that only one sector, Technology, outperformed the overall market during the last year of the bubble.
Active managers significantly underperformed during the Tech Bubble because outperforming necessitated concentration in only one sector, which would not pass so-called prudent man rules. Return-hungry investors, therefore, moved away from active management toward index funds or highly concentrated sector funds. This ultimately proved to be a terrible mistake.
The lost decade in equities
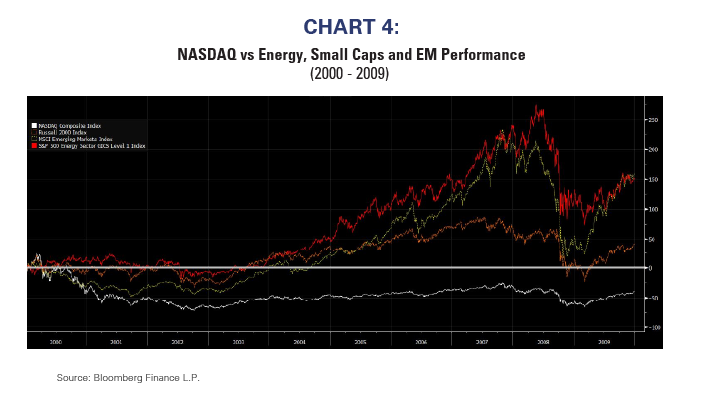
Once the Tech Bubble deflated, the equity market began an extended period of underperformance which came to be known as “the lost decade in equities.” From December 31, 1999 to December 31, 2009, the S&P 500® returned -1%/year, whereas NASDAQ returned -5%/year [or -6%/year for the NASDAQ 100]. In fact, if one had bought NASDAQ at the peak of the Tech Bubble in March 2000, it would’ve taken nearly 14 years to simply break even!
However, certain segments within the global equity markets performed extremely well during the lost decade. Chart 4 shows NASDAQ’s extended underperformance (white line) versus the significant outperformance of the energy sector, small caps, and emerging markets.
There seems a common misperception that the current speculative period of narrow outperformance is vastly different from that during the Tech Bubble because the Magnificent 7 companies are “real companies” and not the worthless IPOs issued during the Tech Bubble. Few seem to realize the Tech Bubble was indeed led by real companies.
Chart 5 recaps what happened to the 6 largest Technology companies (as of December 1999) after the Tech Bubble burst. These were real companies with strong balance sheets and cash flow. The quickest stock to post positive returns still took roughly 7 years to recover. The longest recovery among these real companies was more than 20 years, i.e., much longer than the period shown in the chart. (Note: RBA may own the companies mentioned in various portfolios.)

Today’s bubble
The bubble today isn’t being inflated by stories of the internet, but by a similar story about the exciting future of artificial intelligence (AI). The combination the AI hype and immense pandemic-related liquidity that has not been fully absorbed into the real economy has inflated equity valuations and created highly speculative and narrow leadership.
US M2 growth peaked at 27% which is the highest in modern US history. That huge money growth, like the money growth that fueled the Tech Bubble, could not be fully absorbed into the real economy, and has fueled another financial bubble.
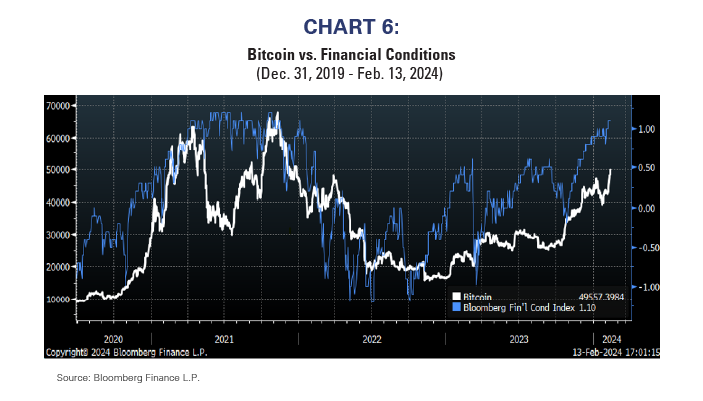
The extreme amounts of excess liquidity have also fueled a bubble in cryptocurrencies. Chart 6 shows the close relationship between financial conditions and Bitcoin. , this relationship demonstrates well that excess liquidity and easier financial conditions are prime determinants of Bitcoin’s value.
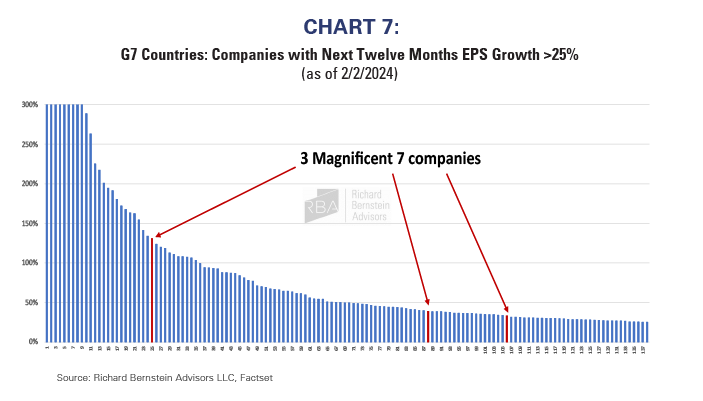
Investors should seriously question the narrow leadership and valuations of the so-called Magnificent 7 stocks. Whereas some of today’s Magnificent 7 do have strong fundamental growth, that growth isn’t uniform within the seven stocks nor is it unique relative to many non-Magnificent 7 companies’ growth prospects. Chart 7 shows there are currently about 140 stocks within the G-7 equity markets (US, Canada, Germany, Japan, France, the UK, and Italy) projected to grow earnings 25% or more over the next year. Most importantly, only 3 of the Magnificent 7 pass the screen and the fastest growing of the Magnificent 7 ranks only 25th.
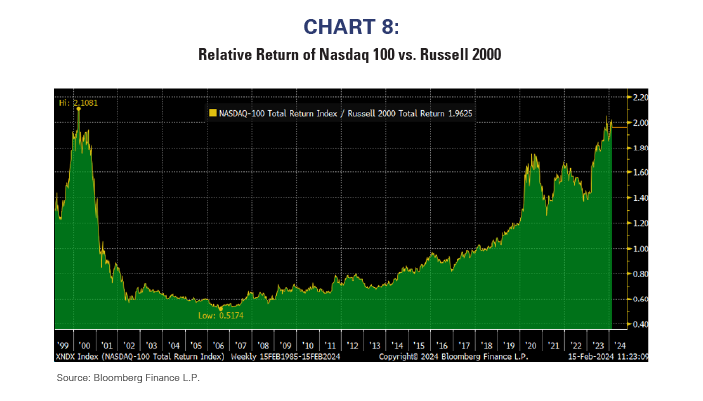
The relative performance between the NASDAQ 100 and the Russell 2000 is as extreme as it was during the Tech Bubble. Chart 8 shows the relative total return between the two indices. History seems to be repeating: new technology hype, significant liquidity, bubble outperformance, investors’ enthusiasm and risk-taking. Will another lost decade in equities be next?
Diversification is the key to avoiding another lost decade
Investors should consider what they are missing with their Magnificent 7 myopia. Shunning diversification has never been prudent, and that’s certainly true during bubble environments. The key to future returns may be simple, basic diversification.
As we emphasized in the first chart, the range of underappreciated investment opportunities seems historically broad and historically attractive. Given the last time similar opportunities arose was after the Tech Bubble, which was 24 years ago, we don’t think we are exaggerating when we describe this as a once-in-a-generation opportunity.
For more news, information, and analysis, visit the ETF Strategist Channel.