

Headlines abound suggesting a weakening from the U.S. consumer. Articles detailing persistent inflation, growing credit card usage, and an increasing number of past-due loan payments make things sound shaky. However, we think that historical context is necessary. Comparing current income growth rates, consumer debt-to-income levels, and delinquency rates to history suggests that personal income has been growing faster than inflation while households in general are only getting back to normal debt-to-income levels after a period of massive government stimulus.
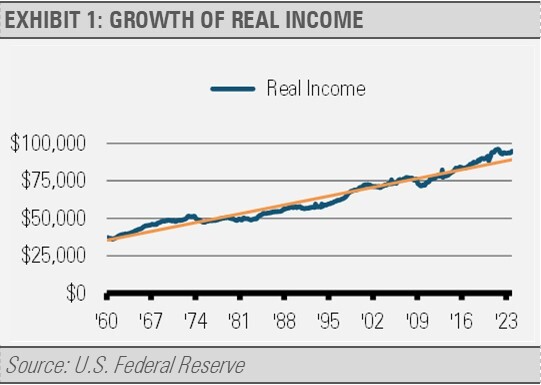
As the following graph illustrates, workers on average are making more money than ever before even after adjusting for inflation. In our view, income growth above the rate of inflation continues to be very positive and bullish for the US economy.
Looking at debt levels, the following graph shows the percentage of disposable (i.e., after-tax) income that households dedicate to servicing specific types of debt.
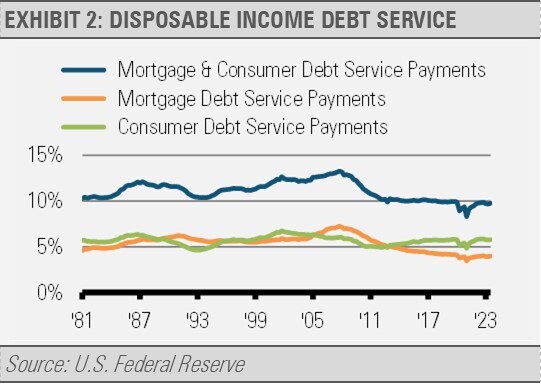
The combination of mortgage and consumer debt as a percentage of disposable income was 9.8% in the third quarter of 2023, the latest data available. This has increased from the post-pandemic government stimulus backed days, which experienced the lowest debt-to-income levels in history going back to 1980.
Current debt-to-income levels are in line with the previous business cycle trend, which saw a great deal of private sector deleveraging. We note that these figures are still well below the 2001-2007 business cycle trough of 12.2% and also below the 1990’s trough level of 10.4% and the 1980’s trough of 10.3%. While these broad debt-to-income levels have been increasing, context matters. Increasing debt-to-income levels are only just getting back to historical averages overall.
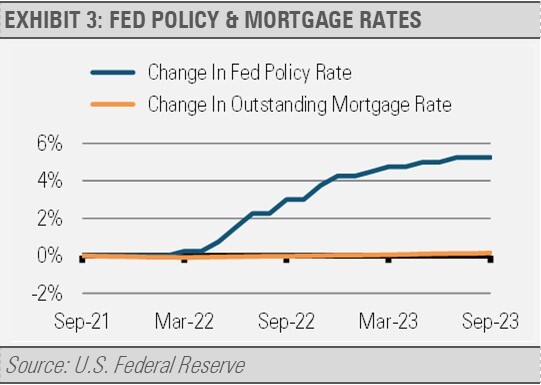
Meanwhile, U.S. homeowners took advantage of multiple years of lower interest rates to further buttress their finances for decades to come. More than 90% of U.S. mortgages are fixed rate, which typically locks in interest rates for 15 or 30 years. We can see the positive long-term impact of these fixed rate mortgages reflected in the change in the average outstanding mortgage interest rate compared to the pace of interest rates hikes enacted by the U.S. Federal Reserve (Fed) over the last two years. While the Fed has raised short-term interest rates by nearly 5.5% over the last two years, the average outstanding mortgage rate is up only 0.15% over that same period.
This is not to say that consumers are not at risk today. We are seeing worsening financial conditions for lower income households especially. In fact, according to the New York Federal Reserve, delinquency rates from credit cards and auto loans are still rising above pre-pandemic levels. Younger and lower-income households are being hit especially hard by this financial stress. We are watching these areas closely for further deterioration or improvement in the months to come.
While economic risks do exist, U.S. economic growth continues into 2024. This is reflected in improving real personal income growth and strong jobs gains. Combined, these datapoints reflect solid economic growth and suggest that the risk of a recession in the near term is low. Despite a low risk of recession in the near-term, we keep a vigilant eye on developing economic trends and put them into their proper context.
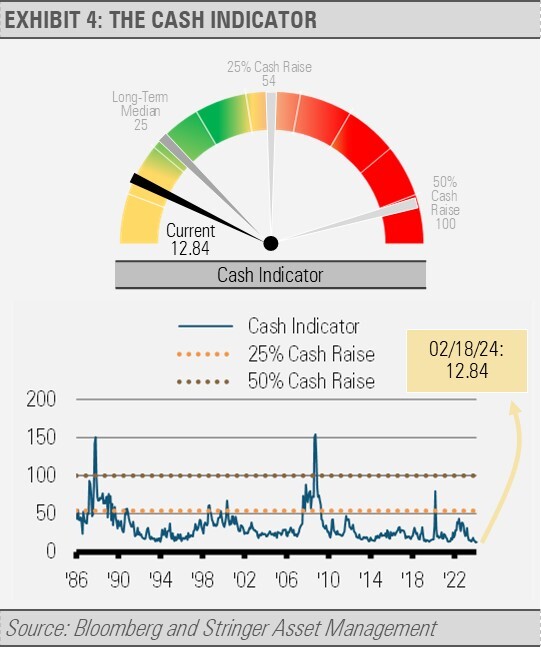
CASH INDICATOR
The Cash Indicator (CI) has been persistently low. Tight credit spreads and little equity market volatility suggest little room for error. Geopolitical, economic, or other risk factors may not be properly discounted in the current market environment. As a result, any negative surprise may cause an overreaction and volatility. Given the solid economic backdrop, this volatility is likely a buying opportunity.
DISCLOSURES
Any forecasts, figures, opinions or investment techniques and strategies explained are Stringer Asset Management, LLC’s as of the date of publication. They are considered to be accurate at the time of writing, but no warranty of accuracy is given and no liability in respect to error or omission is accepted. They are subject to change without reference or notification. The views contained herein are not to be taken as advice or a recommendation to buy or sell any investment and the material should not be relied upon as containing sufficient information to support an investment decision. It should be noted that the value of investments and the income from them may fluctuate in accordance with market conditions and taxation agreements and investors may not get back the full amount invested.
Past performance and yield may not be a reliable guide to future performance. Current performance may be higher or lower than the performance quoted.
The securities identified and described may not represent all of the securities purchased, sold or recommended for client accounts. The reader should not assume that an investment in the securities identified was or will be profitable.
Data is provided by various sources and prepared by Stringer Asset Management, LLC and has not been verified or audited by an independent accountant.
For more news, information, and analysis, visit the ETF Strategist Channel.