

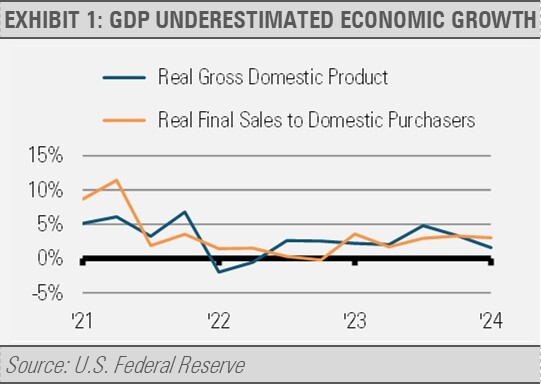
Like we stated in 2022 when first quarter 2022 real gross domestic product (GDP) was negative, U.S. economic growth is stronger than the GDP numbers reflect. As was the case then, first quarter 2024 economic growth was stronger than the 1.6% annualized growth that GDP estimates. This is due to how GDP is calculated. Imports detract from GDP while exports are additive. Taken together, net trade, which accounts for both imports and exports, detracted significantly from both first quarter 2022 and first quarter 2024 GDP.
However, imports are not necessarily a bad thing. In the first quarter of 2022, the U.S. saw a spike in imports as pandemic era supply chain bottlenecks, especially at the Ports of Long Beach and Los Angeles, were resolved. Most recently, imports significantly outweighed exports as the U.S. economy continues to be relatively stronger than other major economies around the world. Note that both imports and exports grew during the first quarter, it’s just that imports grew faster than exports. Domestic economic strength drove imports faster than slower growing foreign economies drove exports.
Instead of only looking at real GDP growth, we can get a clearer picture of U.S. economic growth by also considering real final sales to private domestic purchasers, which excludes the effects of foreign trade as well as changes in inventories and government spending. While real GDP growth slowed in the first quarter to a 1.6% annualized rate, real final sales to private domestic purchasers was a more robust 3.1% annualized rate (exhibit 1). Once again, we have to look at additional data to get a clearer understanding of economic trends, and currently those trends reflect robust U.S. economic growth.
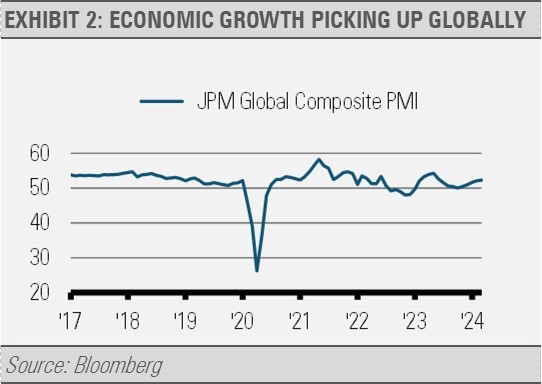
Additionally, economic growth seems to be spreading globally as economic activity around the world has recently gained momentum. As reflected in the JP Morgan Global Composite Purchasing Managers Index (PMI), the rate of global economic expansion improved to a ten-month high in April. It appears that the worst of the global economic slowdown may be behind us, at least for the time being.
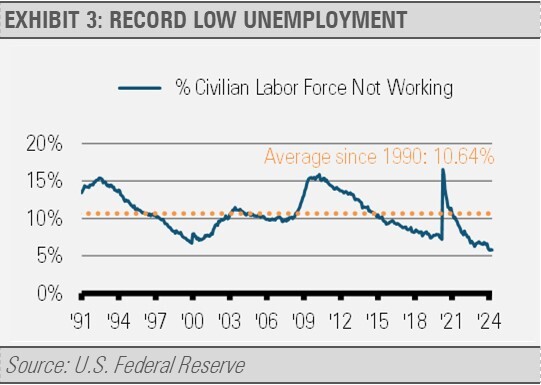
Domestically, labor market shortages persist. Our work suggests that much of this is now the result of there just not being that many unemployed people relative to the size of the economy and the labor force.
While the official unemployment rate does not include those not looking for work, our analysis includes all civilians 16 years or older whether they are looking for work or not. Here, we find some interesting trends going back over the decades.
For example, in the 1950s and early 1960s, more than 20% of the civilian labor force on average was not working. From the middle-to-late 1960s through the 1980s, the percentage of the civilian labor force not working for any reason declined as more women entered the workforce. From 1990 on, that average held steady at about 11%. Today, we are down to about 6% of the civilian labor force not employed, which is an all-time low. That is to say, there are just not that many Americans 16 years old and over who are not working relative to the size of the potential labor pool.
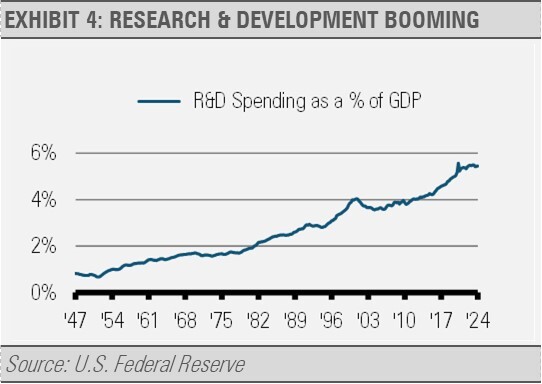
Helping make the labor force more productive and drive innovation, investment in research and development (R&D), which drives innovation across the economy, has been growing at a brisk pace. For example, at the height of the 1990s excitement around the information revolution, R&D spending peaked at about 4% of GDP or a $422B annualized rate. In the first quarter of 2024, R&D investment has climbed to an all-time high of 5.5% of GDP or more than a $1.5T annualized rate (exhibits 4 and 5). That is more than three times the annual rate that was in the 1990s in absolute dollar terms.
INVESTMENT IMPLICATIONS
Investments like this can drive labor force productivity higher, propelling economic growth and improving living standards. The wave of innovation that is instore for us will be unprecedented. Disciplined investors with the wherewithal to withstand equity market volatility stand to reap the benefits from all this business investment well into the future.
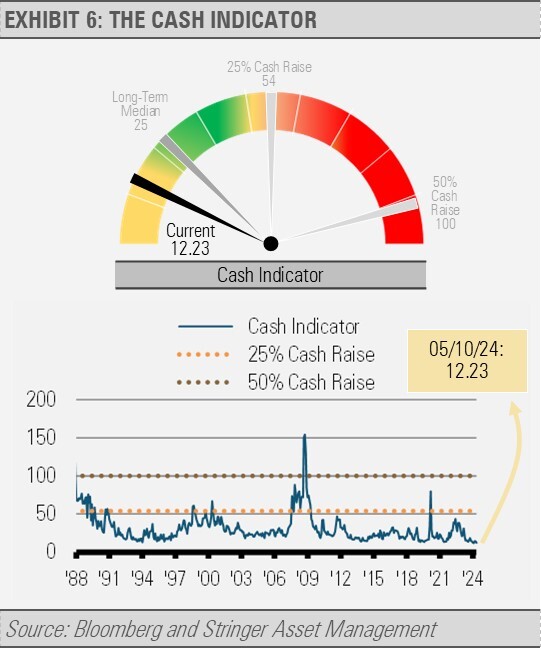
CASH INDICATOR
The Cash Indicator has been at persistently low levels recently. These low levels suggest market complacency reflected in the limited equity market volatility and tight credit spreads. While acknowledging that market timing does not work, we think that investors should expect increased volatility. With the backdrop of solid economic growth, volatility should create opportunities for investors to purchase high quality assets at a discount.
For more news, information, and analysis, visit the ETF Strategist Channel.
DISCLOSURES
Any forecasts, figures, opinions or investment techniques and strategies explained are Stringer Asset Management, LLC’s as of the date of publication. They are considered to be accurate at the time of writing, but no warranty of accuracy is given and no liability in respect to error or omission is accepted. They are subject to change without reference or notification. The views contained herein are not to be taken as advice or a recommendation to buy or sell any investment and the material should not be relied upon as containing sufficient information to support an investment decision. It should be noted that the value of investments and the income from them may fluctuate in accordance with market conditions and taxation agreements and investors may not get back the full amount invested.
Past performance and yield may not be a reliable guide to future performance. Current performance may be higher or lower than the performance quoted.
The securities identified and described may not represent all of the securities purchased, sold or recommended for client accounts. The reader should not assume that an investment in the securities identified was or will be profitable.
Data is provided by various sources and prepared by Stringer Asset Management, LLC and has not been verified or audited by an independent accountant.