

As we have been writing about for the last few months, we are seeing attractive valuations across the global financial markets. For example, the narrowness of this year’s equity market rally has left the capitalization weighted domestic indices, such as the S&P 500 Index and especially the Russell 1000 Growth Index, looking expensive. However, areas that have largely been ignored or even punished this year look both inexpensive and poised to outperform.

Now, let’s compare the current EYs for a broad range of markets to the YTW for the Bloomberg U.S. Aggregate Bond Index and the 90-day Treasury Bill to show the ranges of valuations.
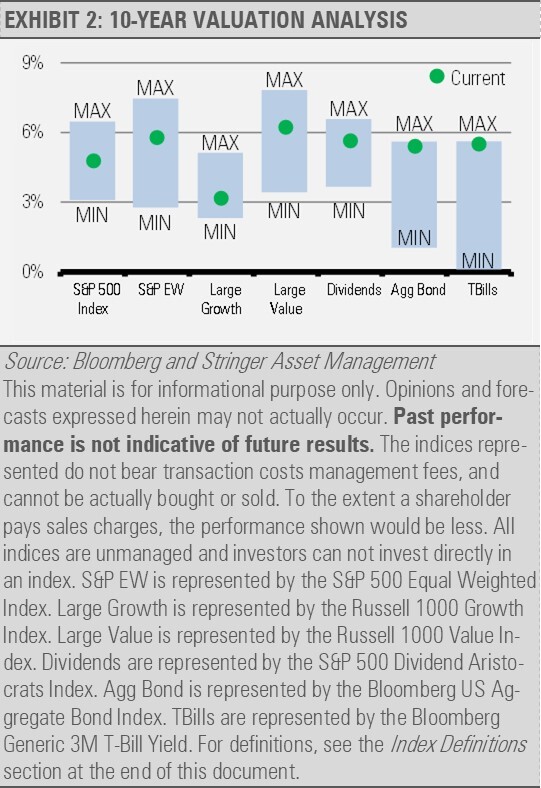
Not only are the expected forward returns for the S&P 500 Index and the Russell 1000 Growth Index low on an absolute basis, but they are also very low relative to what can be expected by investing in other areas of the equity markets as well as what fixed income investments can offer.
We would not advocate for exiting the equity market for bonds based on valuations alone. What we would suggest is that asset allocation, which lagged the broad equity market in a perfect storm of narrow equity markets and rising interest rates, may place investors in an excellent position to take advantage of the reversal. This shift can put well-allocated strategies ahead of these trends to potentially outperform across equity and fixed income.
History and experience teach us that paying up to invest in areas that have already had a strong run, especially those that are trading at speculative levels, can ultimately become a very bad prospect. We do not think that the recent stock market winners necessarily need to see a price crash, though the companies with the more stretched valuations are more at risk. It’s simply that history repeatedly suggests that these types of market trends do not last.
INVESTMENT IMPLICATIONS
Our Strategies are focused on those areas of the financial markets that present attractive relative valuations while potentially offering a level of downside protection. We expect these holdings to perform well in the months and years to come. As the current tightening cycle ends and higher rates persist, we should start to see investors seek to take advantage of how attractive these valuations have become. However, it is important to consider today’s economic and geopolitical uncertainties where the flexibility to move across asset classes and investments can prove to be valuable.
THE CASH INDICATOR
While the Cash Indicator (CI) level has increased in recent weeks, it still remains low by historical standards. The move off the recent bottom reflects increased equity market volatility. Still, readings this low reflect financial markets that are overly complacent in our view. We remain defensively positioned and prepared to take advantage of opportunities as they emerge.

DISCLOSURES
Any forecasts, figures, opinions or investment techniques and strategies explained are Stringer Asset Management, LLC’s as of the date of publication. They are considered to be accurate at the time of writing, but no warranty of accuracy is given and no liability in respect to error or omission is accepted. They are subject to change without reference or notification. The views contained herein are not to be taken as advice or a recommendation to buy or sell any investment and the material should not be relied upon as containing sufficient information to support an investment decision. It should be noted that the value of investments and the income from them may fluctuate in accordance with market conditions and taxation agreements and investors may not get back the full amount invested.
Past performance and yield may not be a reliable guide to future performance. Current performance may be higher or lower than the performance quoted.
The securities identified and described may not represent all of the securities purchased, sold or recommended for client accounts. The reader should not assume that an investment in the securities identified was or will be profitable.
Data is provided by various sources and prepared by Stringer Asset Management, LLC and has not been verified or audited by an independent accountant.
Index Definitions:
Bloomberg U.S. Aggregate Bond Index – This Index provides a measure of the U.S. investment grade bond market, which includes investment grade U.S. Government bonds, investment grade corporate bonds, mortgage pass-through securities and asset-backed securities that are publicly offered for sale in the United States. The securities in the Index must have at least 1 year remaining to maturity. In addition, the securities must be denominated in US dollars and must be fixed rate, nonconvertible and taxable.
Russell 1000 Growth Index – This Index measures the performance of the large cap growth segment of the U.S. equity universe. It includes those Russell 1000 companies with relatively higher price-to-book ratios, higher I/B/E/S forecast medium term growth and higher sales per share historical growth. The Index is constructed to provide a comprehensive and unbiased barometer for the large-cap growth segment. The Index is completely reconstituted annually to ensure new and growing equities are included and that the represented companies continue to reflect growth characteristics.
Russell 1000 Value Index – This Index measures the performance of the large cap value segment of the U.S. equity universe. It includes those Russell 1000 companies with relatively lower price-to-book ratios, lower I/B/E/S forecast medium term growth and lower sales per share historical growth. The Index is constructed to provide a comprehensive and unbiased barometer for the large-cap value segment. The Index is completely reconstituted annually to ensure new and growing equities are included and that the represented companies continue to reflect value characteristics.
S&P 500 Index – This Index is a capitalization-weighted index of 500 stocks. The Index is designed to measure performance of a broad domestic economy through changes in the aggregate market value of 500 stocks representing all major industries.
S&P 500 Equal Weight Index – This Index is the equal-weight version of the widely-used S&P 500 Index. The Index includes the same constituents as the capitalization weighted S&P 500 Index, but each company in the Equal Weight Index is allocated a fixed weight – or +0.2% of the index total at each quarterly rebalance.
S&P 500 Dividend Aristocrats Index – This Index tracks companies within the S&P 500 Index that have a record of raising their dividends for at least 25 consecutive years. Each company is equally weighted within the Index. S&P will remove companies from the Index when they fail to increase dividend payments from the previous year. The Index’s universe includes stocks with a float-adjusted market capitalization of at least $3 billion and an average daily trading volume of at least $5 million, in addition to consistently increasing dividend payments. The index requires a minimum of 40 companies.
For more news, information, and analysis, visit the ETF Strategist Channel.