

By Brendan Ryan, CFA Partner, Portfolio Manager
Over the trailing two years, a portfolio of 60% US Stocks and 40% US Bonds have returned -8%, while sustaining a max monthly drawdown of -14.5%. This was one of the worst stretches in history for the bedrock of diversified portfolios. On average a 60/40 has been negative in just 24% of two-year spans and a double-digit decline is less than a one in ten event.[1]
What’s most rare about the last two years is that they weren’t exclusively driven by the riskier part of the portfolio. When rates rise rapidly, all else being equal, every cash flowing asset becomes less valuable and in the recent aggressive rate hiking cycle nearly every cash flowing asset has been underwater.
[1] Bloomberg data using a monthly rebalance of 60% S&P 500® Index and 40% Barclays Aggregate Bond index from 12/31/1975 to 11/30/2023.
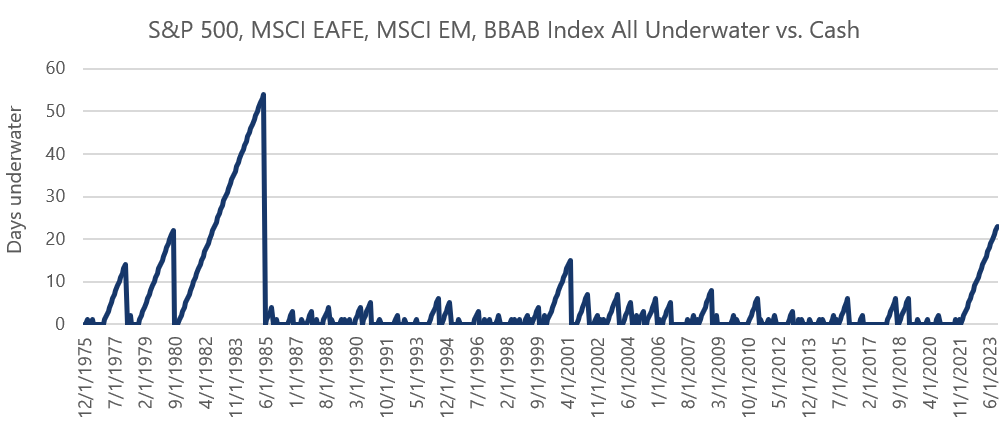
Given that investors price risky assets off a risk-free reference rate in order to generate a return above that rate, which has held true historically[2], only a unique set of circumstances should allow for cash to outperform for an extended period of time. As the chart shows there has been just one such period in recent history: the infamous stagflationary 1970s.
At first glance there are obvious commonalities between the last few years and the 1970s:
- An influx of monetary stimulus
- Rising commodity prices
- Rising wages
- A major supply disruption (The 1974 Oil Embargo and the 2020 Covid Lockdown)
However, the economy of the 1970s was extremely dissimilar to the one we have today. Those differences are why we believe the consistently high inflation of the 1970s was unavoidable but need not re-emerge in our modern economy.
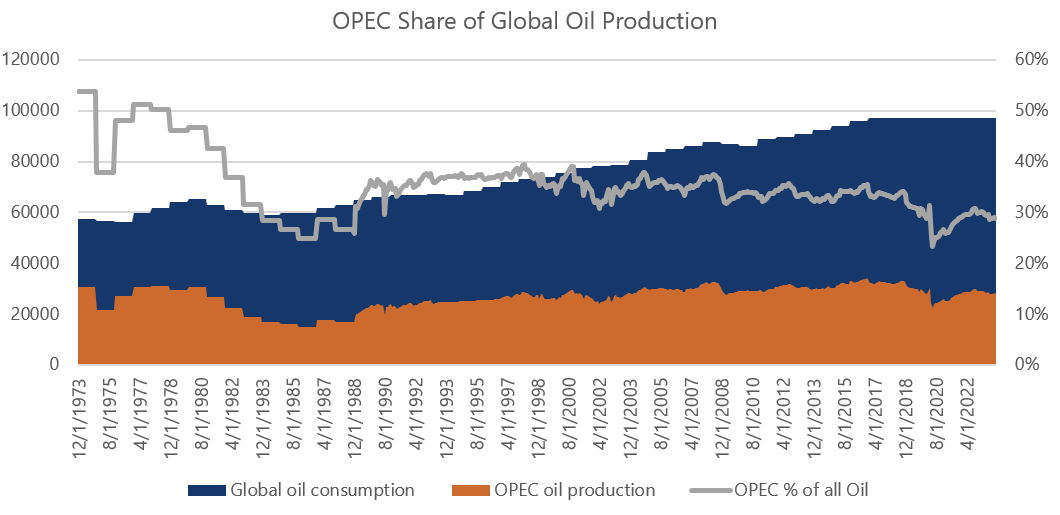
The Role of Oil
While we saw a near 100% increase in Oil prices when Russia invaded Ukraine on top of post Covid economic re-opening, this was paltry compared to the greater than twofold increase in 1974 when Oil jumped from $3.50 to $10.00 on its way to over $14.00. There was no remedy for Oil supply shocks at this time because OPEC commanded a massive share of the oil supply market.
[2] Exhibit 1
Source: Bloomberg data 12/31/1973 to 11/30/2023
Today the United States is the largest oil producing country on the planet, producing at a rate equal to our consumption. Oil was incredibly important as an input to our economy when Manufacturing and Goods were dominant versus today where Services dominate our economy.
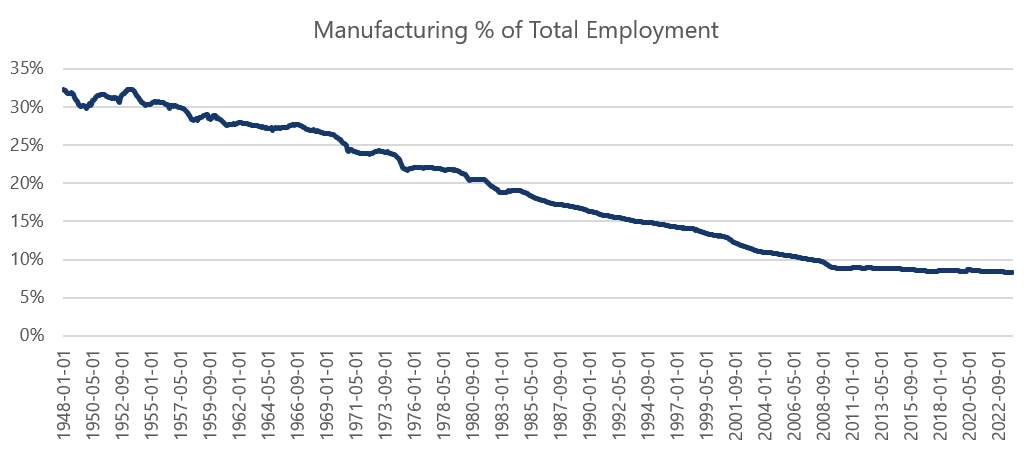
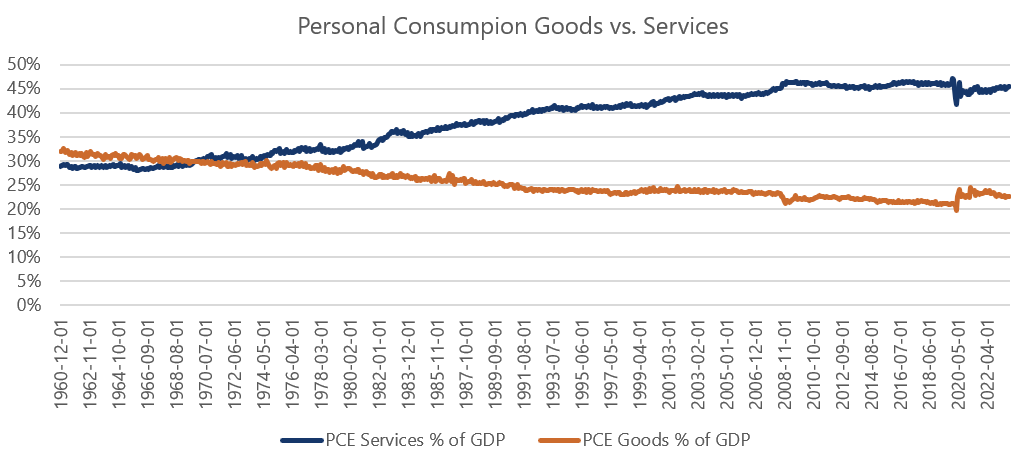
Sources: Bloomberg data for manufacturing employment from 12/31/1947 through 10/31/2023. Data for Personal Consumption from 12/31/1960 to 9/30/2023.
In 1974, an external supply restriction of a key input to the economy (oil) shrunk economic potential on top of higher input prices which created the conditions necessary for stagflation. Normally when the economy shrinks companies need fewer employees and unemployment rises. In turn, employees often command a lower wage (at least after inflation – a low “real” wage) in a bad economy with higher unemployment which ultimately allows companies to hire more of them, and the initial rise in unemployment slowly abates. However, wages tend to be “sticky”, and don’t adjust quickly. As the economy shrank and prices rose very suddenly in the early 1970s, wages (especially after inflation – real wages) did not adjust appropriately low enough to improve unemployment thus creating the final piece of the stagflation puzzle – high unemployment alongside high inflation.
As further evidence of the outsized role of oil, estimated by some economists to have reduced manufacturing output by 60% during the 1970s[3], inflation actually had fallen to just 5.06% by November 1976[4]—roughly 3 years after the embargo. Inflation only subsequently rose again as oil itself rose again due to the Iranian revolution in 1978 which again restricted global oil supply.
As our current environment has no such forced supply constraints, we expect free market economics should continue to work. High prices incentivize more supply which in turn reduces prices, while low prices incentivize less supply and in turn leads to higher prices.
While we are likely to experience a period of higher inflation and interest rates than we have become accustomed to in the zero-interest rate period preceding COVID, there is no reason to abandon basic investing principles including seeking a diversified portfolio to weather the storm and meet a financial plan no matter what lies ahead.
Exhibit 1. Historical Asset Class Returns in Excess of Cash
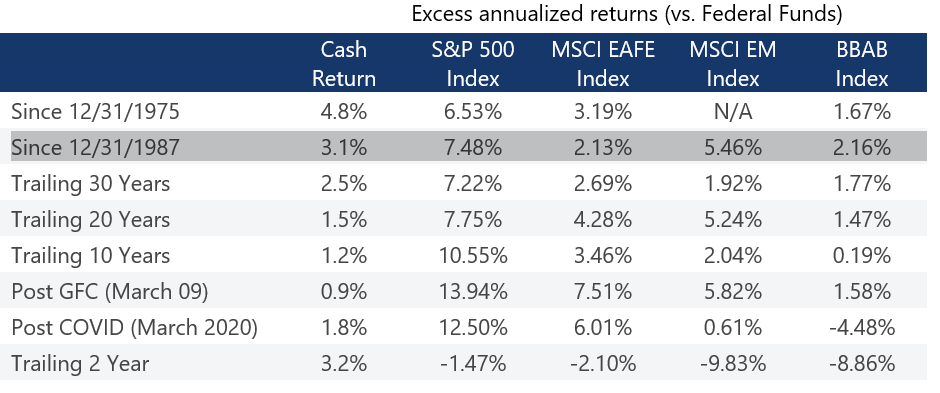
Bloomberg data 12/31/1975 – 11/30/2023 and 12/31/1987 – 11/30/1975 Cash return is the hypothetical return of holding the federal funds rate All other returns are the compounded return over the time period in excess of the cash return.
[3] Bruno, Michael and Sachs, Jeffrey D., Supply vs. Demand Approaches to the Problem of Stagflation (August 1979). NBER Working Paper No. w0382, Available at SSRN: https://ssrn.com/abstract=261235
[4] CPI for urban consumers yoy, retrieved on Bloomberg
Exhibit 2. 1970s CPI YoY
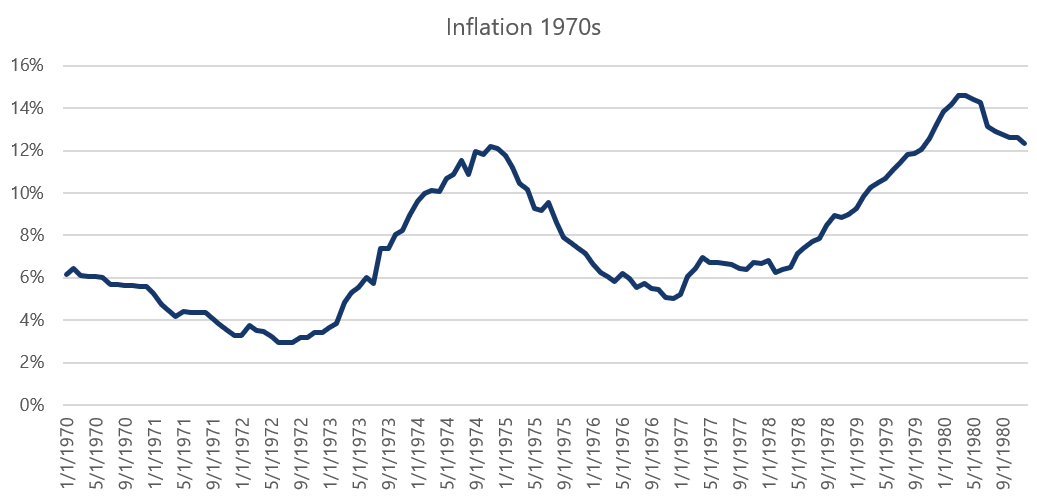
Source: Bloomberg CPI for urban consumers 12/31/1969 to 12/31/1979
For more insights like this, visit blog.investbcm.com.
Disclosures:
Copyright © 2024 Beaumont Capital Management LLC. All rights reserved. All materials appearing in this commentary are protected by copyright as a collective work or compilation under U.S. copyright laws and are the property of Beaumont Capital Management. You may not copy, reproduce, publish, use, create derivative works, transmit, sell or in any way exploit any content, in whole or in part, in this commentary without express permission from Beaumont Capital Management.
Certain information contained herein constitutes “forward-looking statements,” which can be identified by the use of forward-looking terminology such as “may,” “will,” “should,” “expect,” “anticipate,” “project,” “estimate,” “intend,” “continue,” or “believe,” or the negatives thereof or other variations thereon or comparable terminology. Due to various risks and uncertainties, actual events, results or actual performance may differ materially from those reflected or contemplated in such forward-looking statements. Nothing contained herein may be relied upon as a guarantee, promise, assurance or a representation as to the future.
This material is provided for informational purposes only and does not in any sense constitute a solicitation or offer for the purchase or sale of a specific security or other investment options, nor does it constitute investment advice for any person. The material may contain forward or backward-looking statements regarding intent, beliefs regarding current or past expectations. The views expressed are also subject to change based on market and other conditions. The information presented in this report is based on data obtained from third party sources. Although it is believed to be accurate, no representation or warranty is made as to its accuracy or completeness.
The charts and infographics contained in this blog are typically based on data obtained from third parties and are believed to be accurate. The commentary included is the opinion of the author and subject to change at any time. Any reference to specific securities or investments are for illustrative purposes only and are not intended as investment advice nor are they a recommendation to take any action. Individual securities mentioned may be held in client accounts. Past performance is no guarantee of future results.
As with all investments, there are associated inherent risks including loss of principal. Stock markets, especially foreign markets, are volatile and can decline significantly in response to adverse issuer, political, regulatory, market, or economic developments. Sector and factor investments concentrate in a particular industry or investment attribute, and the investments’ performance could depend heavily on the performance of that industry or attribute and be more volatile than the performance of less concentrated investment options and the market as a whole. Securities of companies with smaller market capitalizations tend to be more volatile and less liquid than larger company stocks. Foreign markets, particularly emerging markets, can be more volatile than U.S. markets due to increased political, regulatory, social or economic uncertainties. Fixed Income investments have exposure to credit, interest rate, market, and inflation risk. Diversification does not ensure a profit or guarantee against a loss.
The Standard & Poor’s (S&P) 500® Index is an unmanaged index that tracks the performance of 500 widely held, large-capitalization U.S. stocks. The MSCI Emerging Markets Index captures large and mid cap representation across 27 Emerging Markets (EM) countries. With 1,392 constituents, the index covers approximately 85% of the free float-adjusted market capitalization in each country. The MSCI EAFE Index is an equity index which captures large and mid cap representation across 21 Developed Markets countries around the world, excluding the US and Canada. With 876 constituents, the index covers approximately 85% of the free float adjusted market capitalization in each country. The Bloomberg Aggregate Bond index is designed to represent the full range of investment-grade bonds traded in the U.S. It is composed of more than 10,000 issues. U.S. Treasuries represent nearly 40% of the index. The remaining components represent the debt of major industries including real estate, industrial companies, financial institutions, and utilities.
“S&P 500®” is the registered mark of Standard & Poor’s, Inc., a division of S&P Global Inc. MSCI is a registered trademark of MSCI INC.
The Organization of the Petroleum Exporting Countries (OPEC) is an organization enabling the co-operation of leading oil-producing countries in order to collectively influence the global oil market and maximize profit. It was founded on 14 September 1960 in Baghdad by the first five members.
Consumer prices (CPI) are a measure of prices paid by consumers for a market basket of consumer goods and services. The yearly (or monthly) growth rates represent the inflation rate.
Please contact your BCM Regional Consultant for more information or to address any questions that you may have.
Beaumont Capital Management LLC
125 Newbury St. 4th Floor, Boston, MA 02116 (844-401-7699)
For more news, information, and analysis, visit the ETF Strategist Channel.