

The K-Shaped Income Driven Expansion
Income, productivity, and nominal GDP are booming. Government debt is soaring, but corporate debt is not expanding at the level most have grown accustomed to seeing in the last few decades during economic expansions. This leaves macroeconomists scratching their heads.

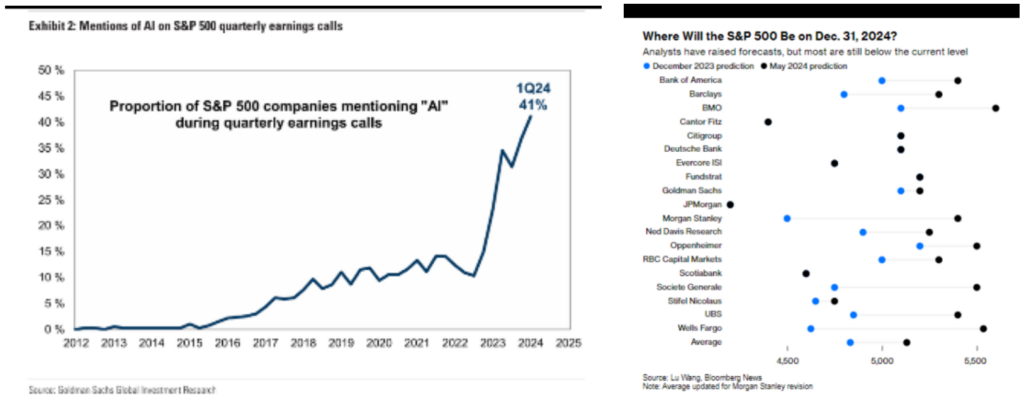
After a weak earnings quarter, markets have rallied back to all-time highs. We entered 2024 expecting 7 rate cuts and a wide range of analyst forecasts for S&P 500 performance in 2024. As expected, most have capitulated, and now most expect 2024 to be rosy with increasing price targets on the S&P 500. All the while, rate cut expectations have all but disappeared. We are riding the wave of income and productivity growth the AI boom has granted us. Earnings season was a story of strong top and bottom-line results, but ultimately still “a miss” primarily due to increasing R&D guidance. We just received the expected bill for the AI boom to continue at such a rapid pace. Innovation is expensive!
Earnings expectations have risen significantly for the S&P 493 that will have to come to fruition by the 4th quarter (with 17% earnings growth expected from this group in the 4th quarter) or else forward-looking earnings multiples will start appearing exceptionally expensive (currently just VERY expensive). The US government continues to run at record deficits, and most assets are heavily correlated with changes in treasury yields.
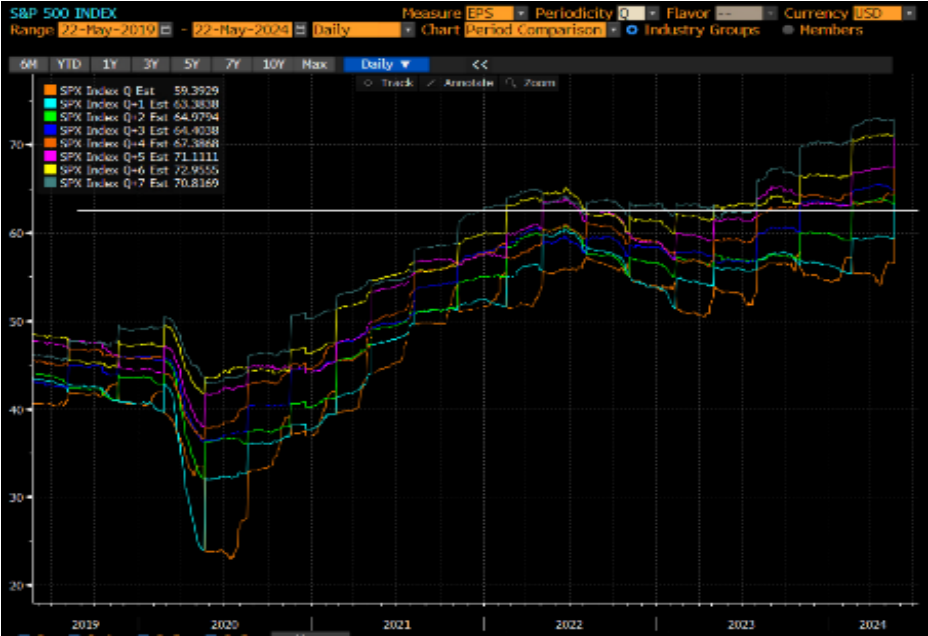
It’s a vicious cycle that could lead to continued pain in both stock and bond markets (or neither) and stocks can continue to climb upwards until yields say otherwise, which is the investment landscape we find ourselves in today! Consensus believes there is a “third rail” 10-year treasury yield rate that could cause pain for all risk assets. Most believe it is somewhere in the 5-5.25% range. We’ve been on the never-ending hunt for $250 dollar earnings on the S&P 500 and we are finally at the point where it is priced in for NEXT quarter, after years of being just around the corner. Buybacks don’t boost earnings on the S&P 500 Index.
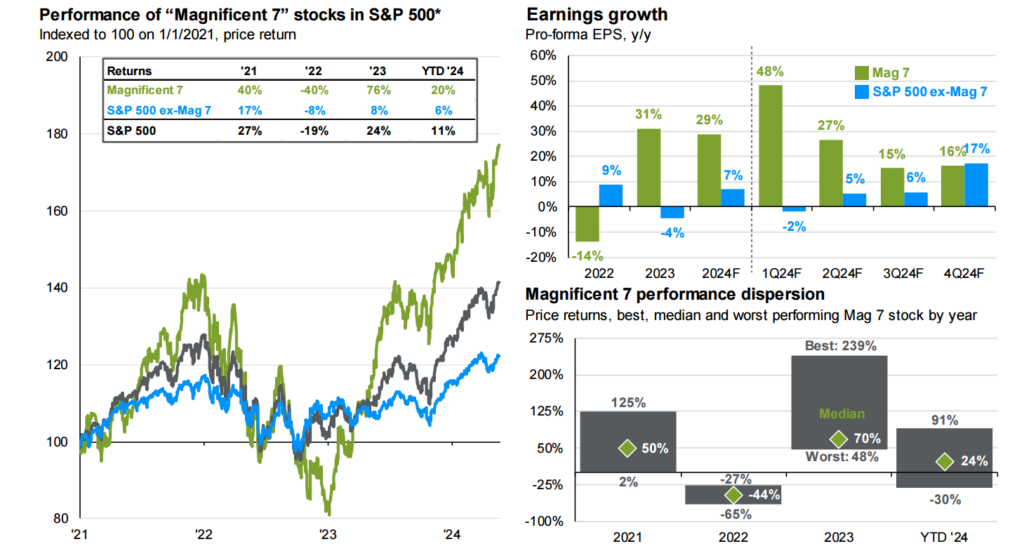
Source: FactSet, Standard & Poor’s, J.P. Morgan Asset Management. *Magnificent 7 includes AAPL, AMZN, GOOG, GOOGL, META, MSFT, NVDA and TSLA. Earnings estimates for 2024 are forecasts based on consensus analyst expectations.
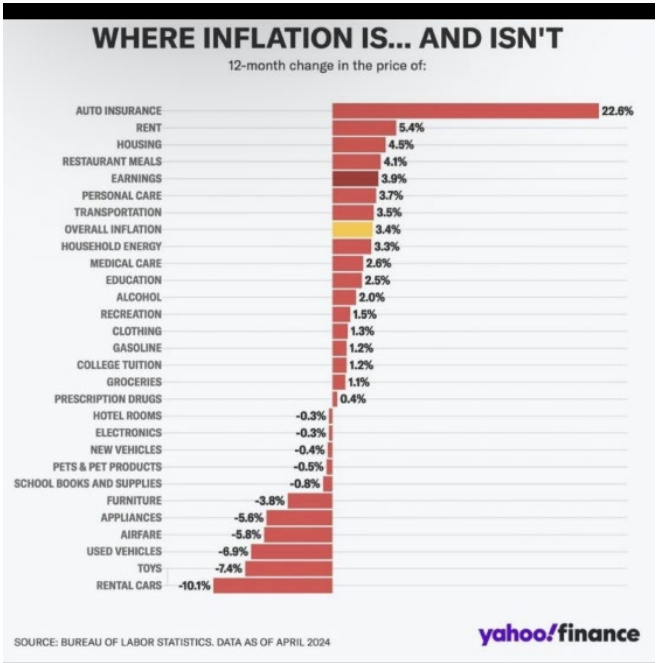
Inflation is not Transitory, Round 2 (but may become transitory again soon, round 3)
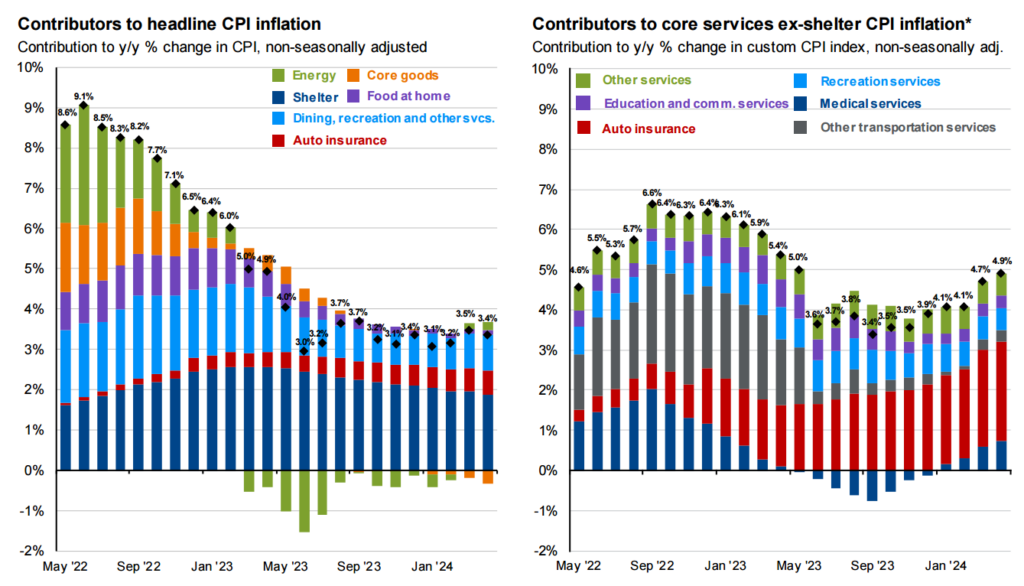
Source: BLS, FactSet, J.P. Morgan Asset Management. Contributions mirror the BLS methodology on Table 7 of the CPI report. Values may not sum to headline CPI figures due to rounding and underlying calculations. *Core services ex-shelter CPI is a custom index using CPI components created by J.P. Morgan Asset Management. (Left) “Shelter” includes owners’ equivalent rent, rent of primary residence and home insurance. Guide to the Markets – U.S. Data are as of May 20, 2024.
Outside of shelter, much of the inflation story can be tied to lagging categories such as auto insurance. We still believe the high inflation days are in our past, but that could obviously be changed with any number of bills the government may release to appease voters heading into an election. That doesn’t mean we will automatically return to a sub 2% inflationary environment. Inflation could very well remain elevated above 2% for quite some time, but is unlikely to reaccelerate on the upside without additional fiscal or monetary stimulus.
Commercial Real Estate is running on fumes, with regular new stories of buildings across all cities trading at eye-popping discounts. Residential Real estate is trading well above rent equivalents (which is a phenomenon found in most developed markets across the globe, and rental prices are either expanding or about to collapse, depending on what your data source is). If there is any takeaway from this commentary, it is that the data is providing noise on many fronts and not a lot of clarity.
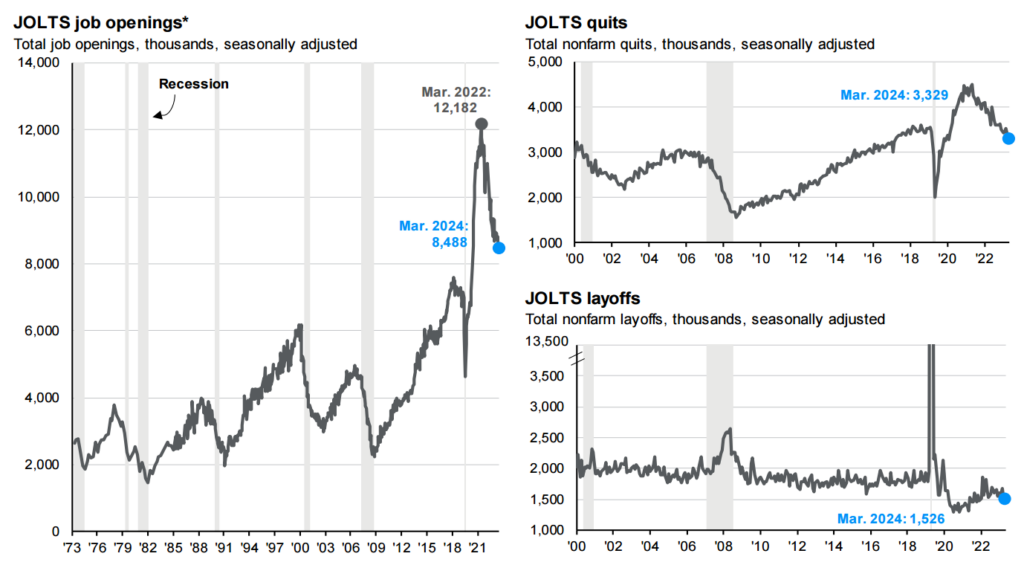
Source: U.S. Department of Labor, J.P. Morgan Asset Management. *JOLTS job openings from February 1974 to November 2000 are J.P. Morgan Asset Management estimates. Guide to the Markets – U.S. Data are as of May 20, 2024.
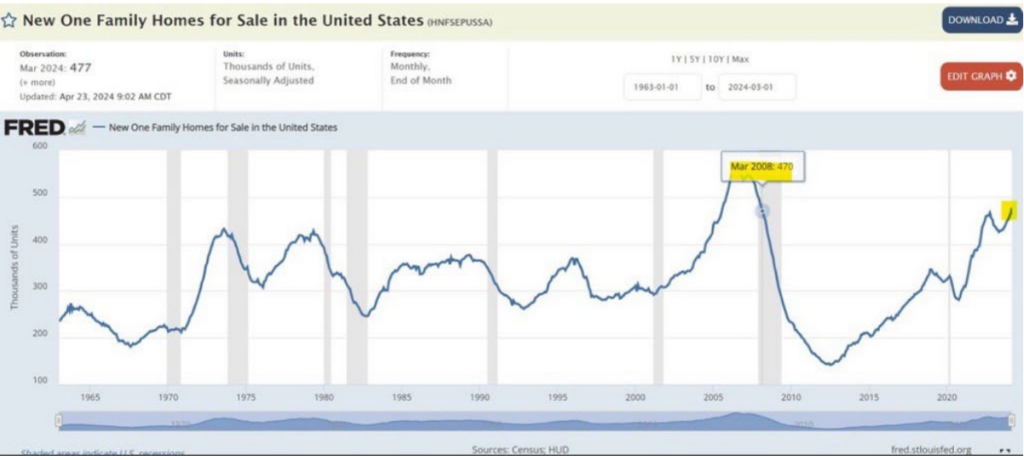
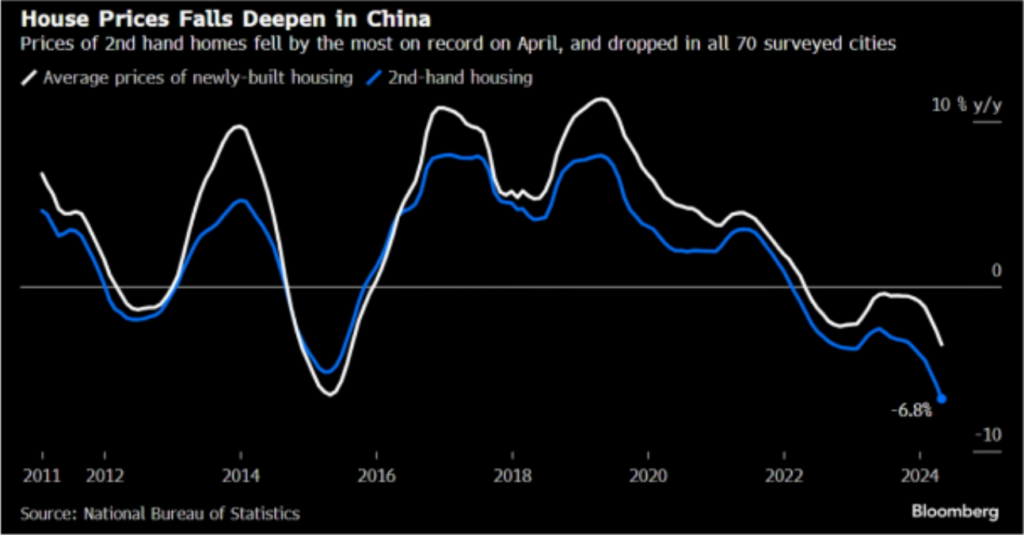
Chinese real estate is facing a US 2008-like housing market moment, and the government is stepping in to buy homes directly. Unlike the US, the banks are basically state owned, and this is unlikely to lead to a wider Chinese banking collapse. Freddie Mac just made a new proposal to try and securitize second leans on home mortgages. This is very stimulative for housing markets over the next decade if passed. Other ideas such as tax credits for first time buyers, downpayment assistance and more are all meant to assist the millions who can’t afford housing. This could also be the exact reasons for housing to irrationally trickle higher over the next few years, making the unaffordability crisis even worse for future first time buyers.
Mid and Small Cap Companies Continue to Underperform
While much can be attributed to sector weightings (large cap indexes have significantly higher exposures to technology companies), it is really the improvement of large cap companies over the last 20 or so years that has caused the outperformance. You can see below, large cap percent of unprofitable companies has fallen to 10%, while small caps still hover around 42%. Interest rate coverage ratios have improved significantly for large caps, even after a drawdown with yields increasing, while small caps are below their EBIT/interest expense averages. Mid and Small caps are very dependent on rates. Higher for longer makes financing much easier for mega caps vs small caps.
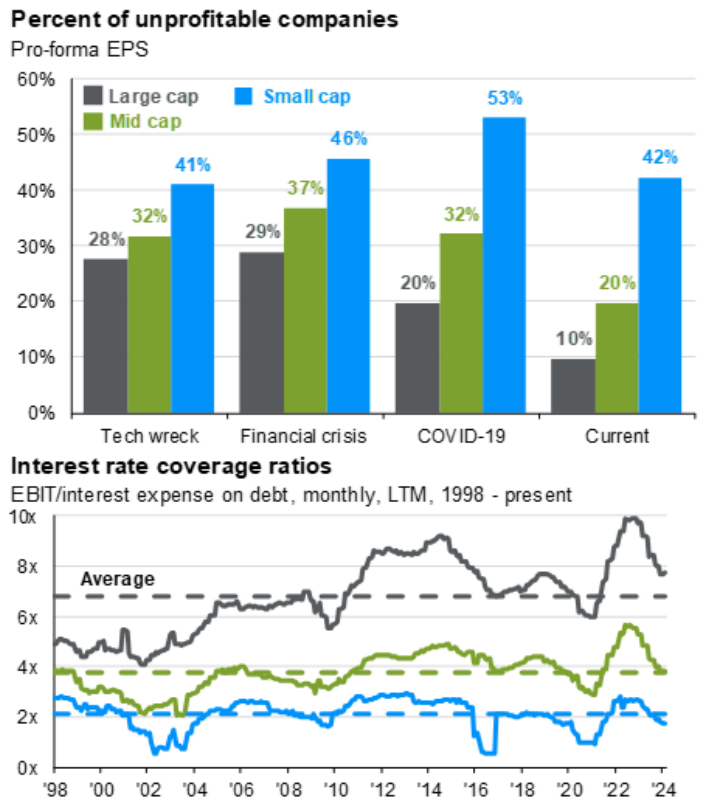
Source: Compustat, FactSet, FTSE Russell, NBER, J.P. Morgan Asset Management. The S&P 500 is used for large cap. The Russell Mid Cap is used for mid cap. The Russell 2000 is used for small cap. Data for the percent of unprofitable companies in each index are from the following quarters: Tech bubble = 4Q01, Financial crisis = 4Q08, COVID-19 = 1Q20 and current = 4Q23. Guide to the Markets – U.S. Data are as of May 20, 2024.
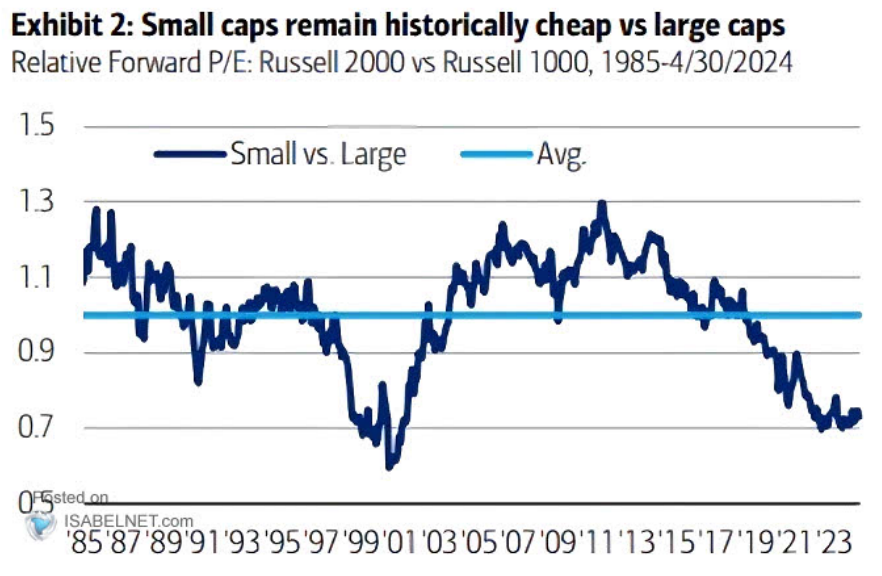
Source: BofA US Equity & Quant Strategy. FactSet
Wacky Fixed Income Markets
Duration has been a huge drag, while credit risk has been a huge reward. Defaults started to tick up and have since rolled back over. There is potential of a pending credit event that many have been expecting for years now, but there are also many variations of the future where it just doesn’t occur any time soon. Much of the high yield market has rolled over its debt, either in public or private markets. The high yield debt maturity wall does not become a substantial risk until 2026. There are many theories as to why high yield has performed so well – its concentration in the energy sector for one, and the proliferation of private credit, making debt available via private capital in a process that ends up cleaning up the quality of high yield debt.
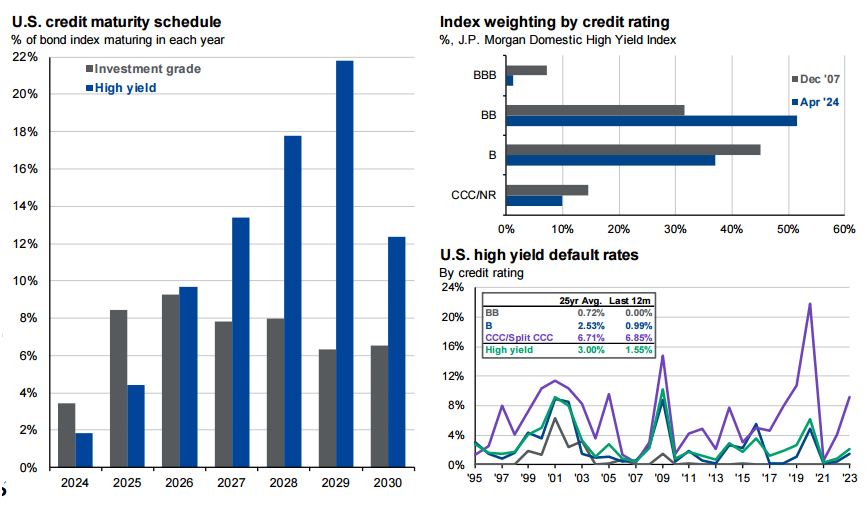
Source: Bloomberg, J.P. Morgan Research, J.P. Morgan Asset Management. Guide to the Markets – U.S. Data are as of May 20, 2024.
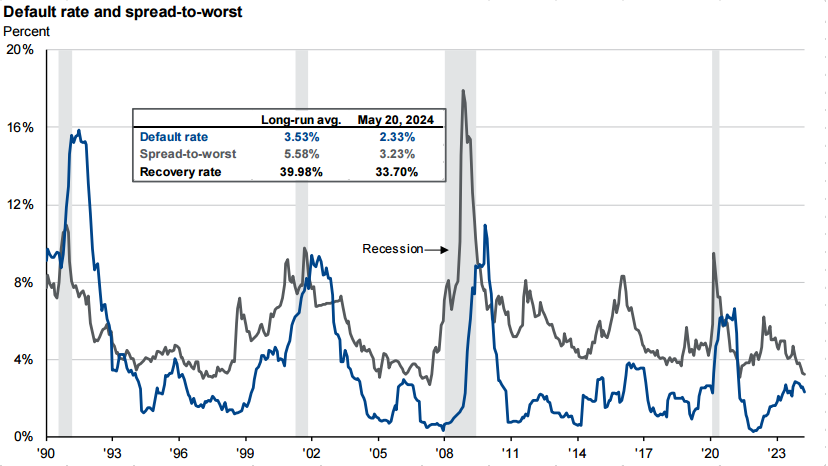
Source: Bloomberg, J.P. Morgan Research, J.P. Morgan Asset Management. Guide to the Markets – U.S. Data are as of May 20, 2024.
Nancy Pelosi is moving stocks like she’s Warren Buffet (and has garnered a quarter billion dollars in wealth doing so). David Portnoy of Barstool shorts certain stocks as much as 7% intraday, roaringkitty is back to pumping GameStop (even presidential candidate RFK jumped into the GameStop wealth destruction saga), and Crypto legislation is being traded for votes by potentially both democratic and republican presidential candidates. Forgive us for not providing a year-end estimate, because it would be completely and utterly useless.
For more news, information, and analysis, visit the ETF Strategist Channel.
Disclosure
All investments involve risk, including possible loss of principal.
The material provided here is for informational purposes only and should not be considered an individualized recommendation or personalized investment advice. The investment strategies mentioned here may not be suitable for everyone. Each investor needs to review an investment strategy for his or her own particular situation before making any investment decision.
All expressions of opinion are subject to change without notice in reaction to shifting market conditions. Data contained herein from third-party providers is obtained from what are considered reliable sources. However, its accuracy, completeness, or reliability cannot be guaranteed.
Examples provided are for illustrative purposes only and not intended to be reflective of results you can expect to achieve.
The value of investments and the income from them can go down as well as up and investors may not get back the amounts originally invested, and can be affected by changes in interest rates, exchange rates, general market conditions, political, social, and economic developments, and other variable factors. Investment involves risks including but not limited to, possible delays in payments and loss of income or capital. Neither Tidal nor any of its affiliates guarantees any rate of return or the return of capital invested. This commentary material is available for informational purposes only and nothing herein constitutes an offer to sell or a solicitation of an offer to buy any security and nothing herein should be construed as such. All investment strategies and investments involve risk of loss, including the possible loss of all amounts invested, and nothing herein should be construed as a guarantee of any specific outcome or profit. While we have gathered the information presented herein from sources that we believe to be reliable, we cannot guarantee the accuracy or completeness of the information presented and the information presented should not be relied upon as such. Any opinions expressed herein are our opinions and are current only as of the date of distribution, and are subject to change without notice. We disclaim any obligation to provide revised opinions in the event of changed circumstances.
The information in this material is confidential and proprietary and may not be used other than by the intended user. Neither Tidal nor its affiliates or any of their officers or employees of Tidal accepts any liability whatsoever for any loss arising from any use of this material or its contents. This material may not be reproduced, distributed, or published without prior written permission from Tidal. Distribution of this material may be restricted in certain jurisdictions. Any persons coming into possession of this material should seek advice for details of and observe such restrictions (if any).