

By Jeff Timlin, Portfolio Manager of Tax-Exempt Fixed Income Strategies
Recent headlines, including positive actions from major rating agencies and substantial amounts of federal aid, suggest that credit conditions in the State of Illinois are on an upward trajectory. Earlier this year Moody’s and S&P each bumped up the state’s rating one notch, to Baa2 and BBB, respectively. In a subsequent rating action, S&P went a step further, raising Illinois’ outlook to positive, implying a one-third chance of an additional upgrade.
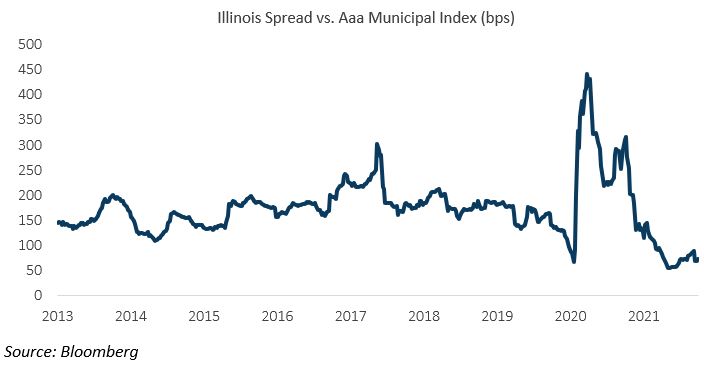
Despite this consensus from the agencies, we believe that they, along with the market, are getting a bit over their skis. Consider this – yields on Illinois’ bonds are more than 100 basis points tighter to the 10-year Aaa municipal benchmark than they were when the state carried a single A bond rating back in 2013. The spread compression has largely been driven by the limited supply of higher-yielding paper currently available in the market rather than any significant improvement in the state’s credit fundamentals.
As illustrated in the chart below, spreads in Illinois have narrowed significantly despite shaky credit quality.
So, what exactly has changed in Illinois? Except for a ton of federal funding and additional bond issuance, not much.
- Officials project that during fiscal year 2021, which ended on June 30, the state realized nearly a $2.7 billion surplus; however, this comes on the heels of billions of dollars of federal aid received through the CARES Act.
- The Illinois Governor’s Office of Management and Budget expects to end fiscal year 2022 with a $1.8 billion surplus, but this relies on about $2 billion of funding from the American Rescue Plan Act.
- The backlog of unpaid bills has declined from a high of more than $16 billion in 2017 to just over $4 billion, though the state issued bonds to paydown a large chunk of the backlog.
- Illinois projects that it will return to structural imbalance beginning in fiscal year 2023, with annual deficits ranging from $400 million to $1.1 billion through fiscal year 2027.
The significant influx of federal funding will eventually run out in Illinois, meaning that the state will once again need to find a way to patch its budgetary holes and manage large unfunded pension liabilities.
The investment case for New Jersey is much stronger.
New Jersey carries the second lowest credit rating in the nation and has pension challenges, but we see a much more robust investment opportunity. The state has a stronger socioeconomic and demographic landscape and has not had issues paying its bills on time. While Illinois’ population declined between 2010 and 2020 – one of only three states to lose residents over that time period – New Jersey’s expanded by a solid 5.7%. Additionally, New Jersey has topped Illinois in new home construction and job growth, while also benefiting from a much lower crime rate.
BOTTOM LINE FOR INVESTORS
Yes, investors can pick up an extra 38 basis points of yield in Illinois as compared to New Jersey, but they do so at a risk that the state will return to its old ways, meaning that its improved credit rating could very well be short lived. Instead, New Jersey’s healthier credit profile and lower principal volatility offer a better alternative on a risk-adjusted basis.
| A weak socioeconomic and demographic landscape will stunt Illinois’ growth | ||
| Illinois | New Jersey | |
| Population growth (2010-2020) | -0.1% | 5.7% |
| Growth in housing units (2010-2020) | 2.4% | 5.8% |
| Job growth (October 2011-October 2021) | 3.0% | 4.7% |
| % of population aged 25+ w/ a 4-year college degree | 35% | 40% |
| Per capita income | $67,243 | $77,193 |
| Violent crime rate per 100,000 inhabitants | 406.9 | 206.9 |
Sources: U.S. Census Bureau, Bureau of Labor Statistics, U.S. Department of Justice.
Disclosures: This is for informational purposes only and is not intended as investment advice or an offer or solicitation with respect to the purchase or sale of any security, strategy or investment product. Although the statements of fact, information, charts, analysis and data in this report have been obtained from, and are based upon, sources Sage believes to be reliable, we do not guarantee their accuracy, and the underlying information, data, figures and publicly available information has not been verified or audited for accuracy or completeness by Sage. Additionally, we do not represent that the information, data, analysis and charts are accurate or complete, and as such should not be relied upon as such. All results included in this report constitute Sage’s opinions as of the date of this report and are subject to change without notice due to various factors, such as market conditions. Investors should make their own decisions on investment strategies based on their specific investment objectives and financial circumstances. All investments contain risk and may lose value. Past performance is not a guarantee of future results.
Sage Advisory Services, Ltd. Co. is a registered investment adviser that provides investment management services for a variety of institutions and high net worth individuals. For additional information on Sage and its investment management services, please view our web site at www.sageadvisory.com, or refer to our Form ADV, which is available upon request by calling 512.327.5530.