

Looking back at the S&P 500 Index in 2023, the return of the Index was dominated by a small number of mega cap stocks termed the magnificent seven. While these stocks accounted for a significant portion of the overall return, many investors will look at that experience and try to draw all sorts of conclusions. One might decide that investing alongside the S&P 500 Index makes the most sense in the hopes that similar performance will repeat. On the other hand, it’s possible that avoiding the magnificent seven entirely and simply owning the other 493 stocks in the Index will have the highest probability of success. What does history tell us and how can that potentially lead us to better outcomes?
For example, consider the lost decade following the 1990’s Tech Bubble. With a starting forward price to earnings ratio (P/E) of 29.56 on 12/31/1999, it is easy to see why the S&P 500 Index struggled over the next decade as there is a clear inverse relationship between equity market valuation and long-term forward returns.
Lost decades are exceedingly rare, but the damage can be real. It is better to act now than be caught unprepared. While the S&P 500 Index is not as expensive today as it was in 1999, its top-heavy nature suggests both rich valuations in those names as well as better opportunities deeper in the market. For example, while the S&P 500 Index posted a flat return over the following decade after 1999, the S&P 500 Equal Weighted Index experienced an annualized total return of 6.56% over the same period, 6.15% higher than the cap-weighted version of the Index.
Although we do not expect a similar lost decade going forward, the recent narrow market rally has created a swath of the equity market that is extremely expensive by historical norms and many others that are inexpensive.
The S&P 500 Index is trading at over 22 times forward earnings as of 12/31/2023, whereas the equal-weighted version of the same 500 companies is trading at 18 times forward earnings. This represents a 22% discount for each dollar of expected earnings compared to the capitalization-weighted Index.
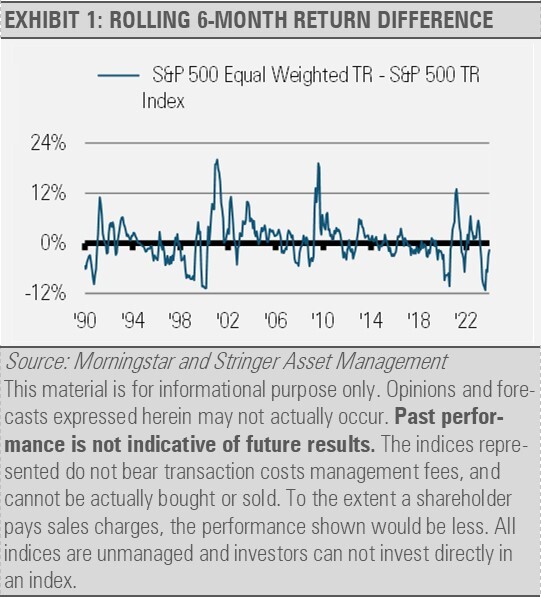
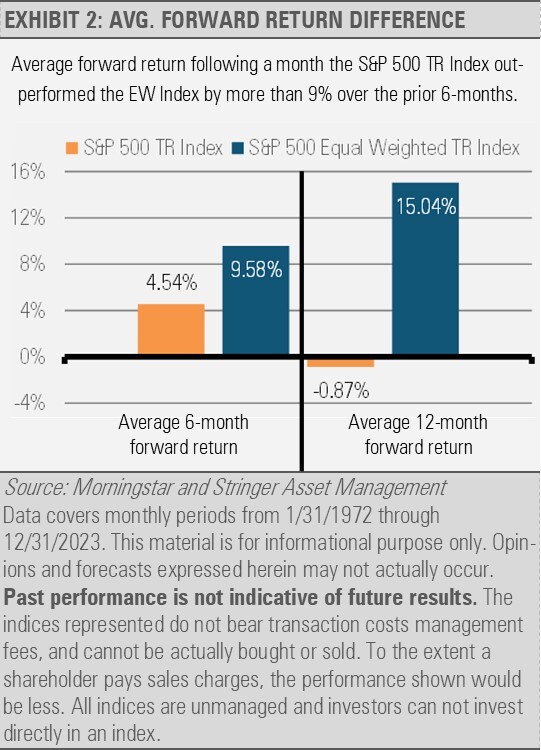
This valuation gap comes after the S&P 500 Index has outperformed the equally weighted S&P 500 Index by an extreme margin. Historically, when the S&P 500 Index has gotten so far ahead of its equal-weighted version, the latter has gone on to outperform significantly.
Looking at history, we can conclude that avoiding market extremes gives investors the highest probability of success. The current narrow market presents opportunities to invest at attractive valuations in areas that we think have significant upside. We are happy to pay a discount for expected earnings and strong return potential compared to those chasing the performance of the capitalization-weighted Index.
That doesn’t mean one should completely avoid those companies that have positive momentum, strong earnings, and growth potential. However, it does suggest moderation and caution where lofty multiples are concerning. Making investments in quality companies at lower valuations is a great way to potentially avoid a lost decade. Today’s equity market offers a host of opportunities to do just that in our opinion.
For more news, information, and analysis, visit the ETF Strategist Channel.
DISCLOSURES
Any forecasts, figures, opinions or investment techniques and strategies explained are Stringer Asset Management, LLC’s as of the date of publication. They are considered to be accurate at the time of writing, but no warranty of accuracy is given and no liability in respect to error or omission is accepted. They are subject to change without reference or notification. The views contained herein are not to be taken as advice or a recommendation to buy or sell any investment and the material should not be relied upon as containing sufficient information to support an investment decision. It should be noted that the value of investments and the income from them may fluctuate in accordance with market conditions and taxation agreements and investors may not get back the full amount invested.
Past performance and yield may not be a reliable guide to future performance. Current performance may be higher or lower than the performance quoted.
The securities identified and described may not represent all of the securities purchased, sold or recommended for client accounts. The reader should not assume that an investment in the securities identified was or will be profitable.
Data is provided by various sources and prepared by Stringer Asset Management, LLC and has not been verified or audited by an independent accountant.
Index Definitions:
S&P 500 Index – This Index is a capitalization-weighted index of 500 stocks. The Index is designed to measure performance of a broad domestic economy through changes in the aggregate market value of 500 stocks representing all major industries.
S&P 500 Equal Weight Index – This Index is the equal-weight version of the widely-used S&P 500 Index. The Index includes the same constituents as the capitalization weighted S&P 500 Index, but each company in the Equal Weight Index is allocated a fixed weight – or +0.2% of the index total at each quarterly rebalance.