

The debate regarding a hard or soft economic landing continues into the summer months. Investors looking for the benefits of value stocks while still leaning towards growth may want to consider opportunities in the VictoryShares Free Cash Flow ETF (VFLO).
VFLO grants investors access to quality companies currently trading at a discount. The ETF holds companies with high free cash flow (FCF) metrics, which can be a sign of quality and operating efficiency. Additionally, these companies exhibit favorable growth potential, allowing investors to capture value stocks with a growth tilt.
FCF is the remaining cash a company has after covering all expenses. It can be used to invest in growing the business, pay dividends, or pay down debt and is often used to measure a company’s health.
See also: “Why Free Cash Flow Could Be the Antidote to High Rates“
The ETF tracks the Victory U.S. Large Cap Free Cash Flow Index (the Index), and its benchmark is the Russell 1000 Value Index. VFLO’s methodology calculates FCF holistically, including both trailing and anticipated FCF based on analyst estimates. Additionally, when weighing companies, the rules-based index accounts for overall FCF and FCF yield.
The Index provides exposure to companies with favorable, forward-looking FCF estimates. It also employs a growth screen for securities included, which eliminates companies with high FCF but weak growth prospects.
VFLO Generates Notable EPS Growth
The constituents of the Index’s forward-looking approach generated better earnings-per-share growth than the benchmark as represented by the ETF. Earnings-per-share (EPS) measures the amount of profit that each share of a company has earned. Constituents generated an EPS growth over the last three years of 23.41% compared to 12.61% for the Russell 1000® Value Index as of 5/31/2024.
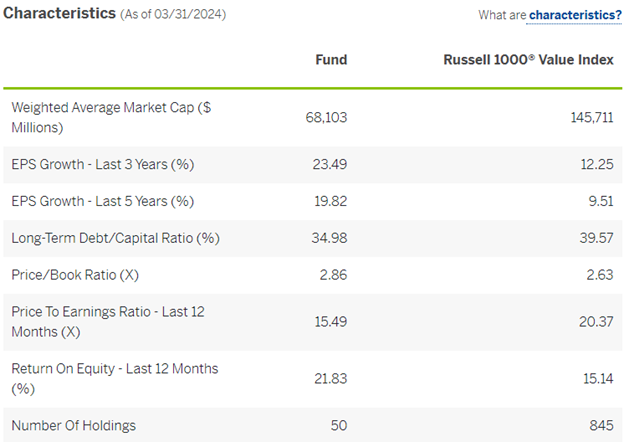
Source: Victory Capital Reporting as of 5/31/2024; For standardized performance of the ETF and benchmark, visit our product page.
Not only did companies within VFLO generate better EPS growth, but they also did so with less leverage. The long-term debt-to-capital ratio for VFLO was 35.62% compared to the Russell 1000® Value’s 39.34% as of 5/31/2024.
VFLO carries a net expense ratio of 0.39% (gross expense ratio of 0.66%).
For more news, information, and analysis, visit the Free Cash Flow Channel.
VettaFi LLC (“VettaFi”) is the index provider for VFLO, for which it receives an index licensing fee. However, VFLO is not issued, sponsored, endorsed, or sold by VettaFi. VettaFi has no obligation or liability in connection with the issuance, administration, marketing, or trading of VFLO.
Definitions
Net expense ratios reflect the contractual waiver and or reimbursement of management fees through at least December 31, 2024.
Market Capitalization is the total dollar value of all outstanding shares computed as number of shares times current market price.
EPS is the portion of a company’s profit allocated to each outstanding share of common stock. Earnings per share serves as an indicator of a company’s profitability.
Long-Term Debt/Capitalization is an indicator of financial leverage. Shows long-term debt as a proportion of the capital available. Determined by dividing long-term debt by the sum of long-term debt, preferred stock and common stockholder’s equity.
Price/Book Ratio compares a stock’s market value to the value of total assets less total liabilities (book value).
Price/Earnings Ratio is the current share price of a stock divided by its earnings per share.
Return on Equity is net income divided by common equity. A measure of how well a company used reinvested earnings to generate additional earnings.
Portfolio Turnover Ratio – LTM measures trading activity in a portfolio for the past year, indicating how often investments are bought and sold.
Disclosure Information
Carefully consider a fund’s investment objectives, risks, charges, and expenses before investing. To obtain a prospectus or summary prospectus containing this and other important information, visit http://www.vcm.com/prospectus. Read it carefully before investing. All investing involves risk, including the potential loss of principal.
All investing involves risk, including the potential loss of principal. Please note that the Fund is a new ETF with a limited history. The Fund has the same risks as the underlying securities traded on the exchange throughout the day. Redemptions are limited, and commissions are often charged on each trade. ETFs may trade at a premium or discount to their net asset value. The ETF invests in securities included in, or representative of securities included in, the Index, regardless of their investment merits.
The performance of the Fund may diverge from that of the Index. Investing in companies with high free cash flows could lead to underperformance when such investments are unpopular or during periods of industry disruptions The ETF could also be affected by company-specific factors that could jeopardize the generation of free cash flow. Investments concentrated in an industry or group of industries may face more risks and exhibit higher volatility than investments that are more broadly diversified over industries or sectors. Derivatives may not work as intended and may result in losses.
Additional Information
If a seed investor redeems its shares, it could negatively impact the Funds’ NAV, market price and brokerage costs. The ETF has the same risks as the underlying securities traded on the exchange throughout the day. Redemptions are limited, and commissions are often charged on each trade. ETFs may trade at a premium or discount to their net asset value. The ETF invests in securities included in, or representative of securities included in, the Index, regardless of their investment merits.
Large shareholders, including other funds advised by the Adviser, may own a substantial amount of the Fund’s shares. The actions of large shareholders, including large inflows or outflows, may adversely affect other shareholders, including potentially increasing capital gains. The value of your investment is also subject to geopolitical risks such as wars, terrorism, environmental disasters, and public health crises; the risk of technology malfunctions or disruptions; and the responses to such events by governments and/or individual companies.
The Victory U.S. Large Cap Free Cash Flow Index aims to select high quality companies from its starting universe by applying profitability screens. It then selects companies with the strongest free cash flow yield that exhibit higher growth. The Index is rebalanced and reconstituted quarterly. This Index calculates free cash flow yield by dividing expected free cash flow by enterprise value. Expected free cash flow is the average of trailing 12-month FCF and next 12-month forward free cash flow. Enterprise value (EV) measures a company’s total value, often used as a more comprehensive alternative to equity market capitalization.
Distributed by Foreside Fund Services, LLC (Foreside). Foreside is not affiliated with Victory Capital Management Inc. (VCM), the Fund’s advisor. Neither Foreside nor VCM are affiliated with VettaFi.
20240624-3643445