
Economic indicators provide insight into the overall health and performance of an economy. They are essential tools for policymakers, advisors, investors, and businesses because they allow them to make informed decisions regarding business strategies and financial markets. In the week ending June 20, the SPDR S&P 500 ETF Trust (SPY) rose 0.84%. The Invesco S&P 500 Equal Weight ETF (RSP) was up 0.39%.
In this article, we look at three closely watched indicators from the past week – retail sales, industrial production, and the Conference Board’s Leading Economic Index (LEI). These indicators might seem unrelated at first. But they all have a significant role in assessing economic health and predicting economic trends. Retail sales and industrial production are among the “big four” recession-determining indicators recognized by the National Bureau of Economic Research (NBER). Furthermore, the LEI serves as a forward-looking indicator. It offers insights into whether the economy is headed toward expansion or recession. Since the end of 2022, there have been ongoing talks around a forthcoming recession, though one has not materialized. These indicators, among others, will remain an important part of the ongoing discussion.
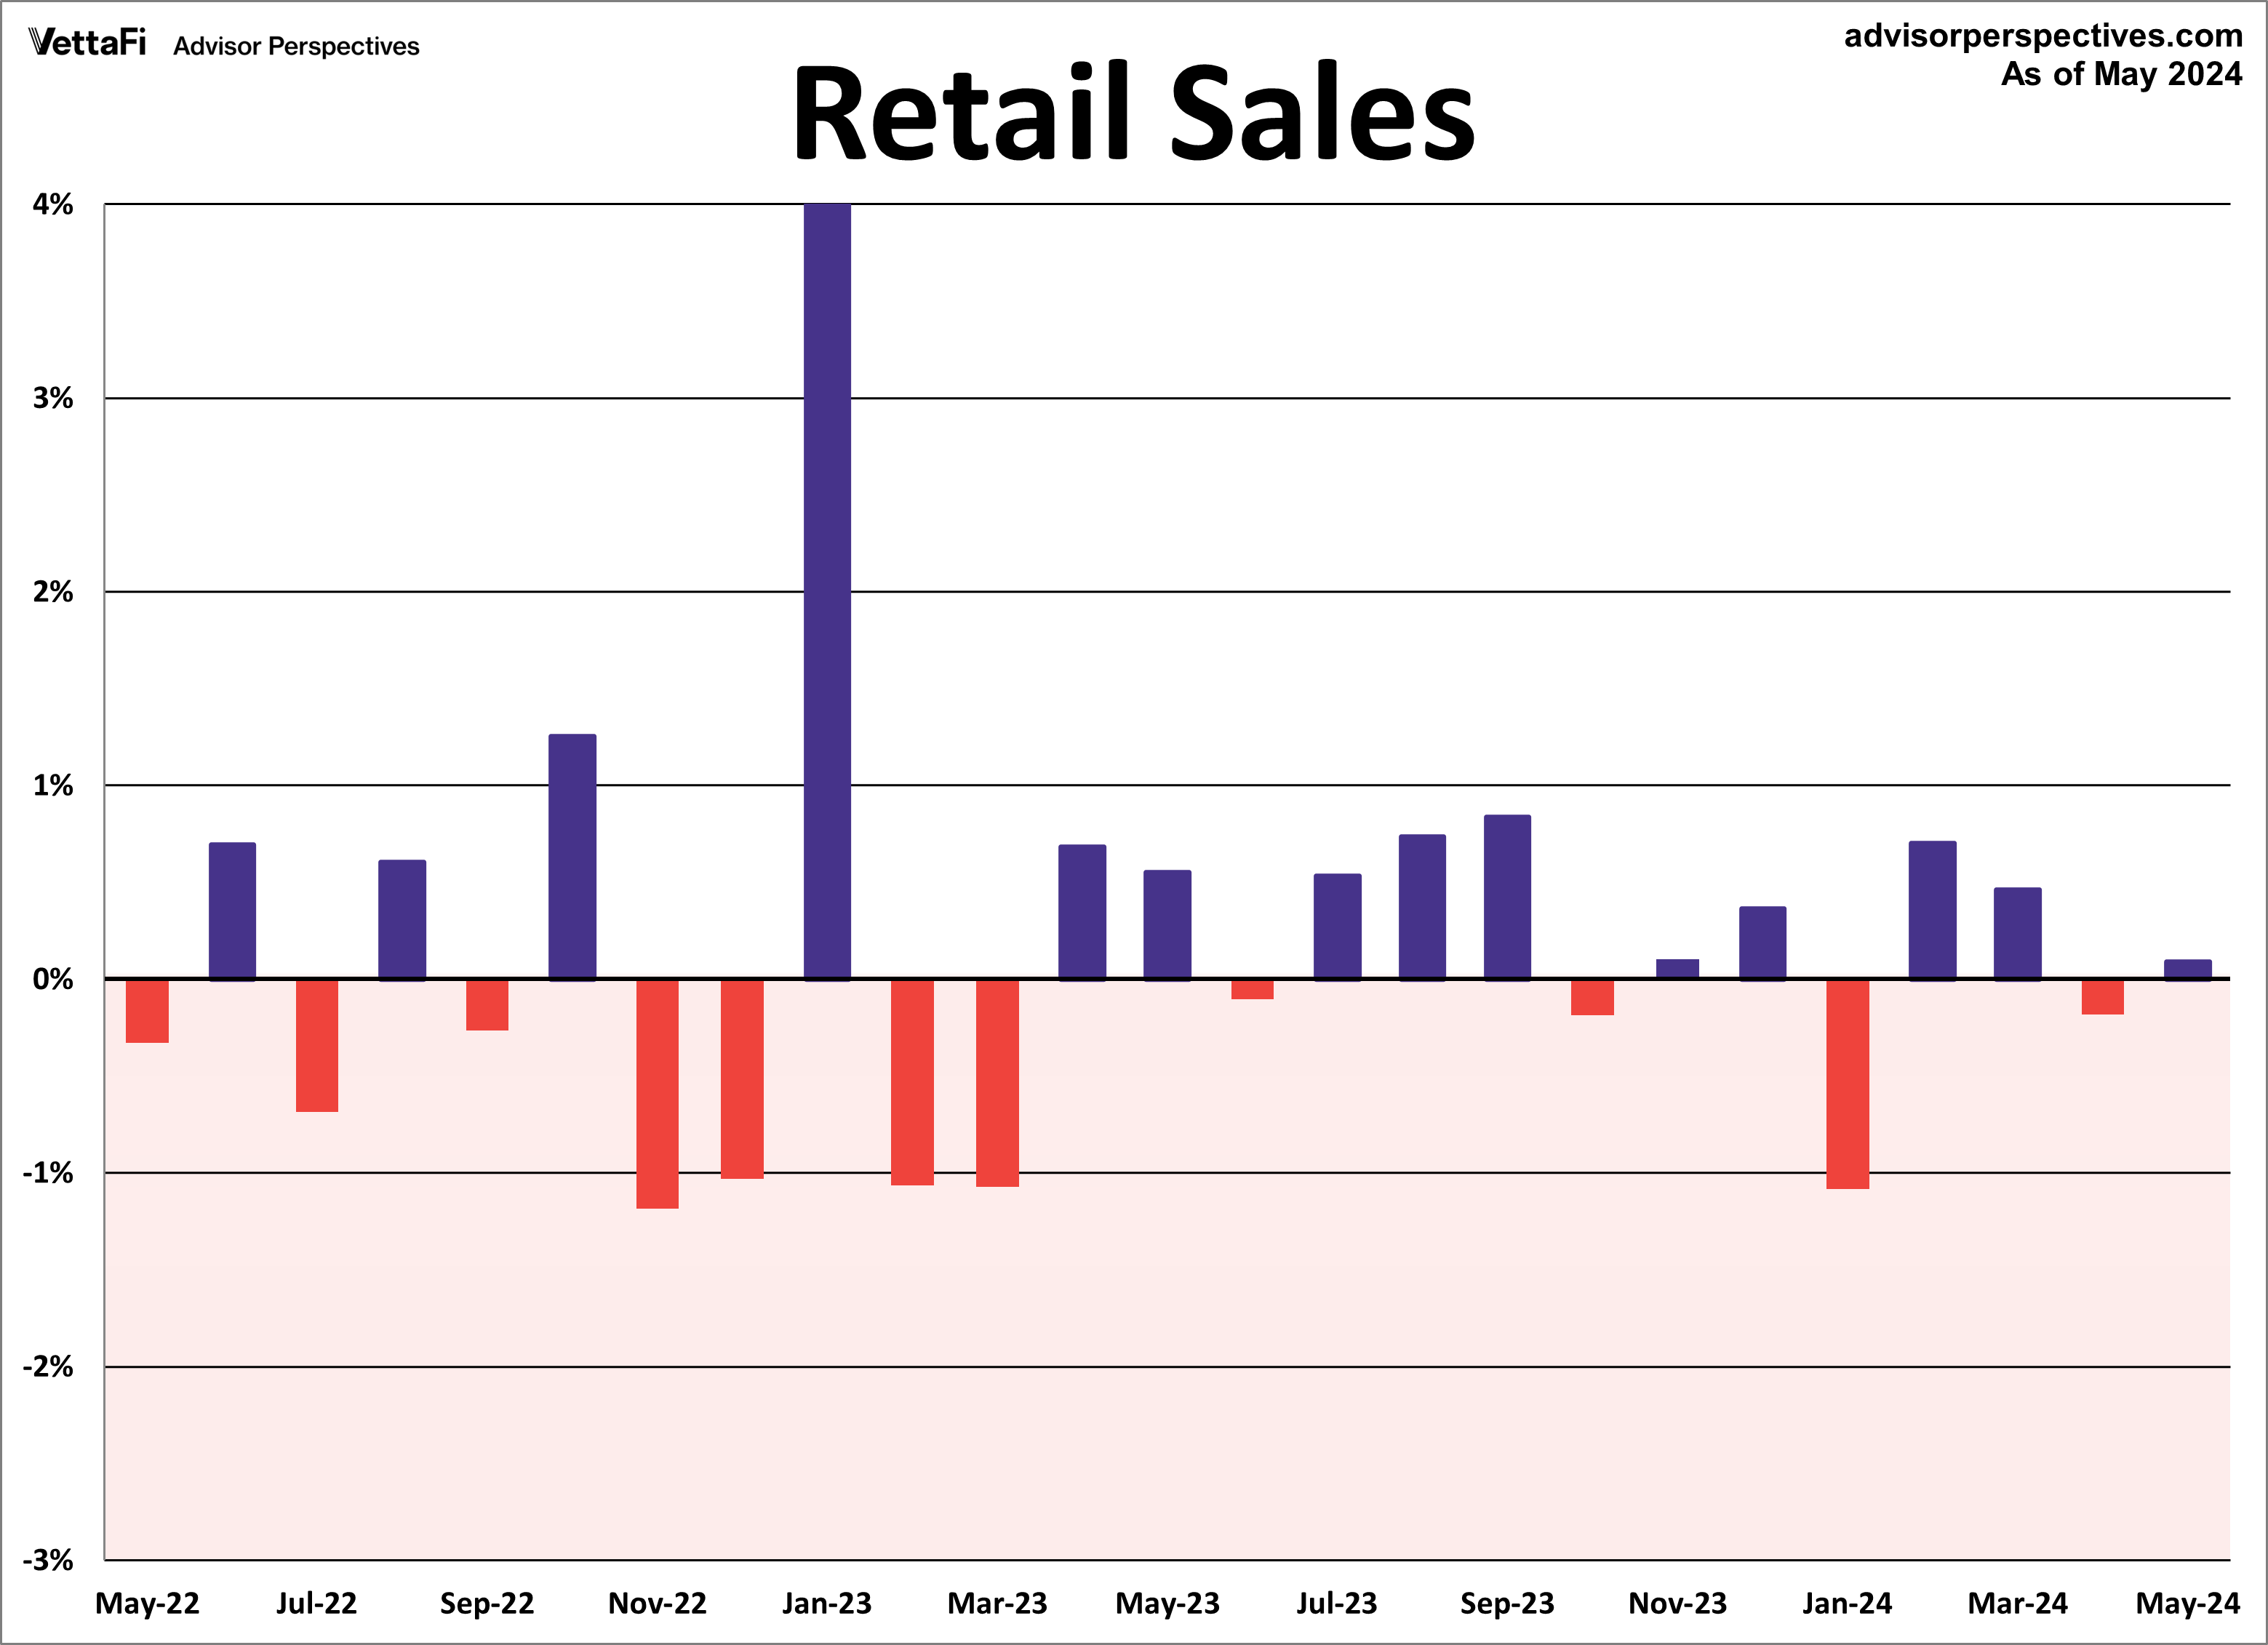
Retail Sales
American consumer spending is off to a slower-than-expected start for 2024. That’s because Americans are continuing to grabble with inflation and elevated rates. Retail sales inched up 0.1% in May, lower than the anticipated 0.3% growth. Additionally, April’s data was revised lower, revealing consumer spending declined 0.2% compared to the initial flat estimate. Consumer spending picked up in a handful of sectors. Those were led by sporting goods, hobbies, musical instruments, and bookstores (2.8%), clothing stores (0.9%), motor vehicle dealers (0.8%), and electronics and appliance stores (0.4%). Meanwhile, most other sectors saw a drop in spending, specifically gas stations, which declined by 2.2%.
Core retail sales (excluding automobiles) were up 0.1% from April, falling short of the expected 0.2% growth. Lastly, control purchases, which is thought to be an even more “core” view of retail sales, were up 0.4% from April, as expected. This series typically does not garner as much attention as the headline and core figures. But control purchases are a more consistent and reliable reading of the economy because it strips out many volatile components.
Overall, the latest retail sales data reinforces the Fed’s stance on a rate cut happening later this year.
Retail sales will have an impact on the interest in the SPDR S&P Retail ETF (XRT), VanEck Retail ETF (RTH), Amplify Online Retail ETF (IBUY), and ProShares Online Retail ETF (ONLN).
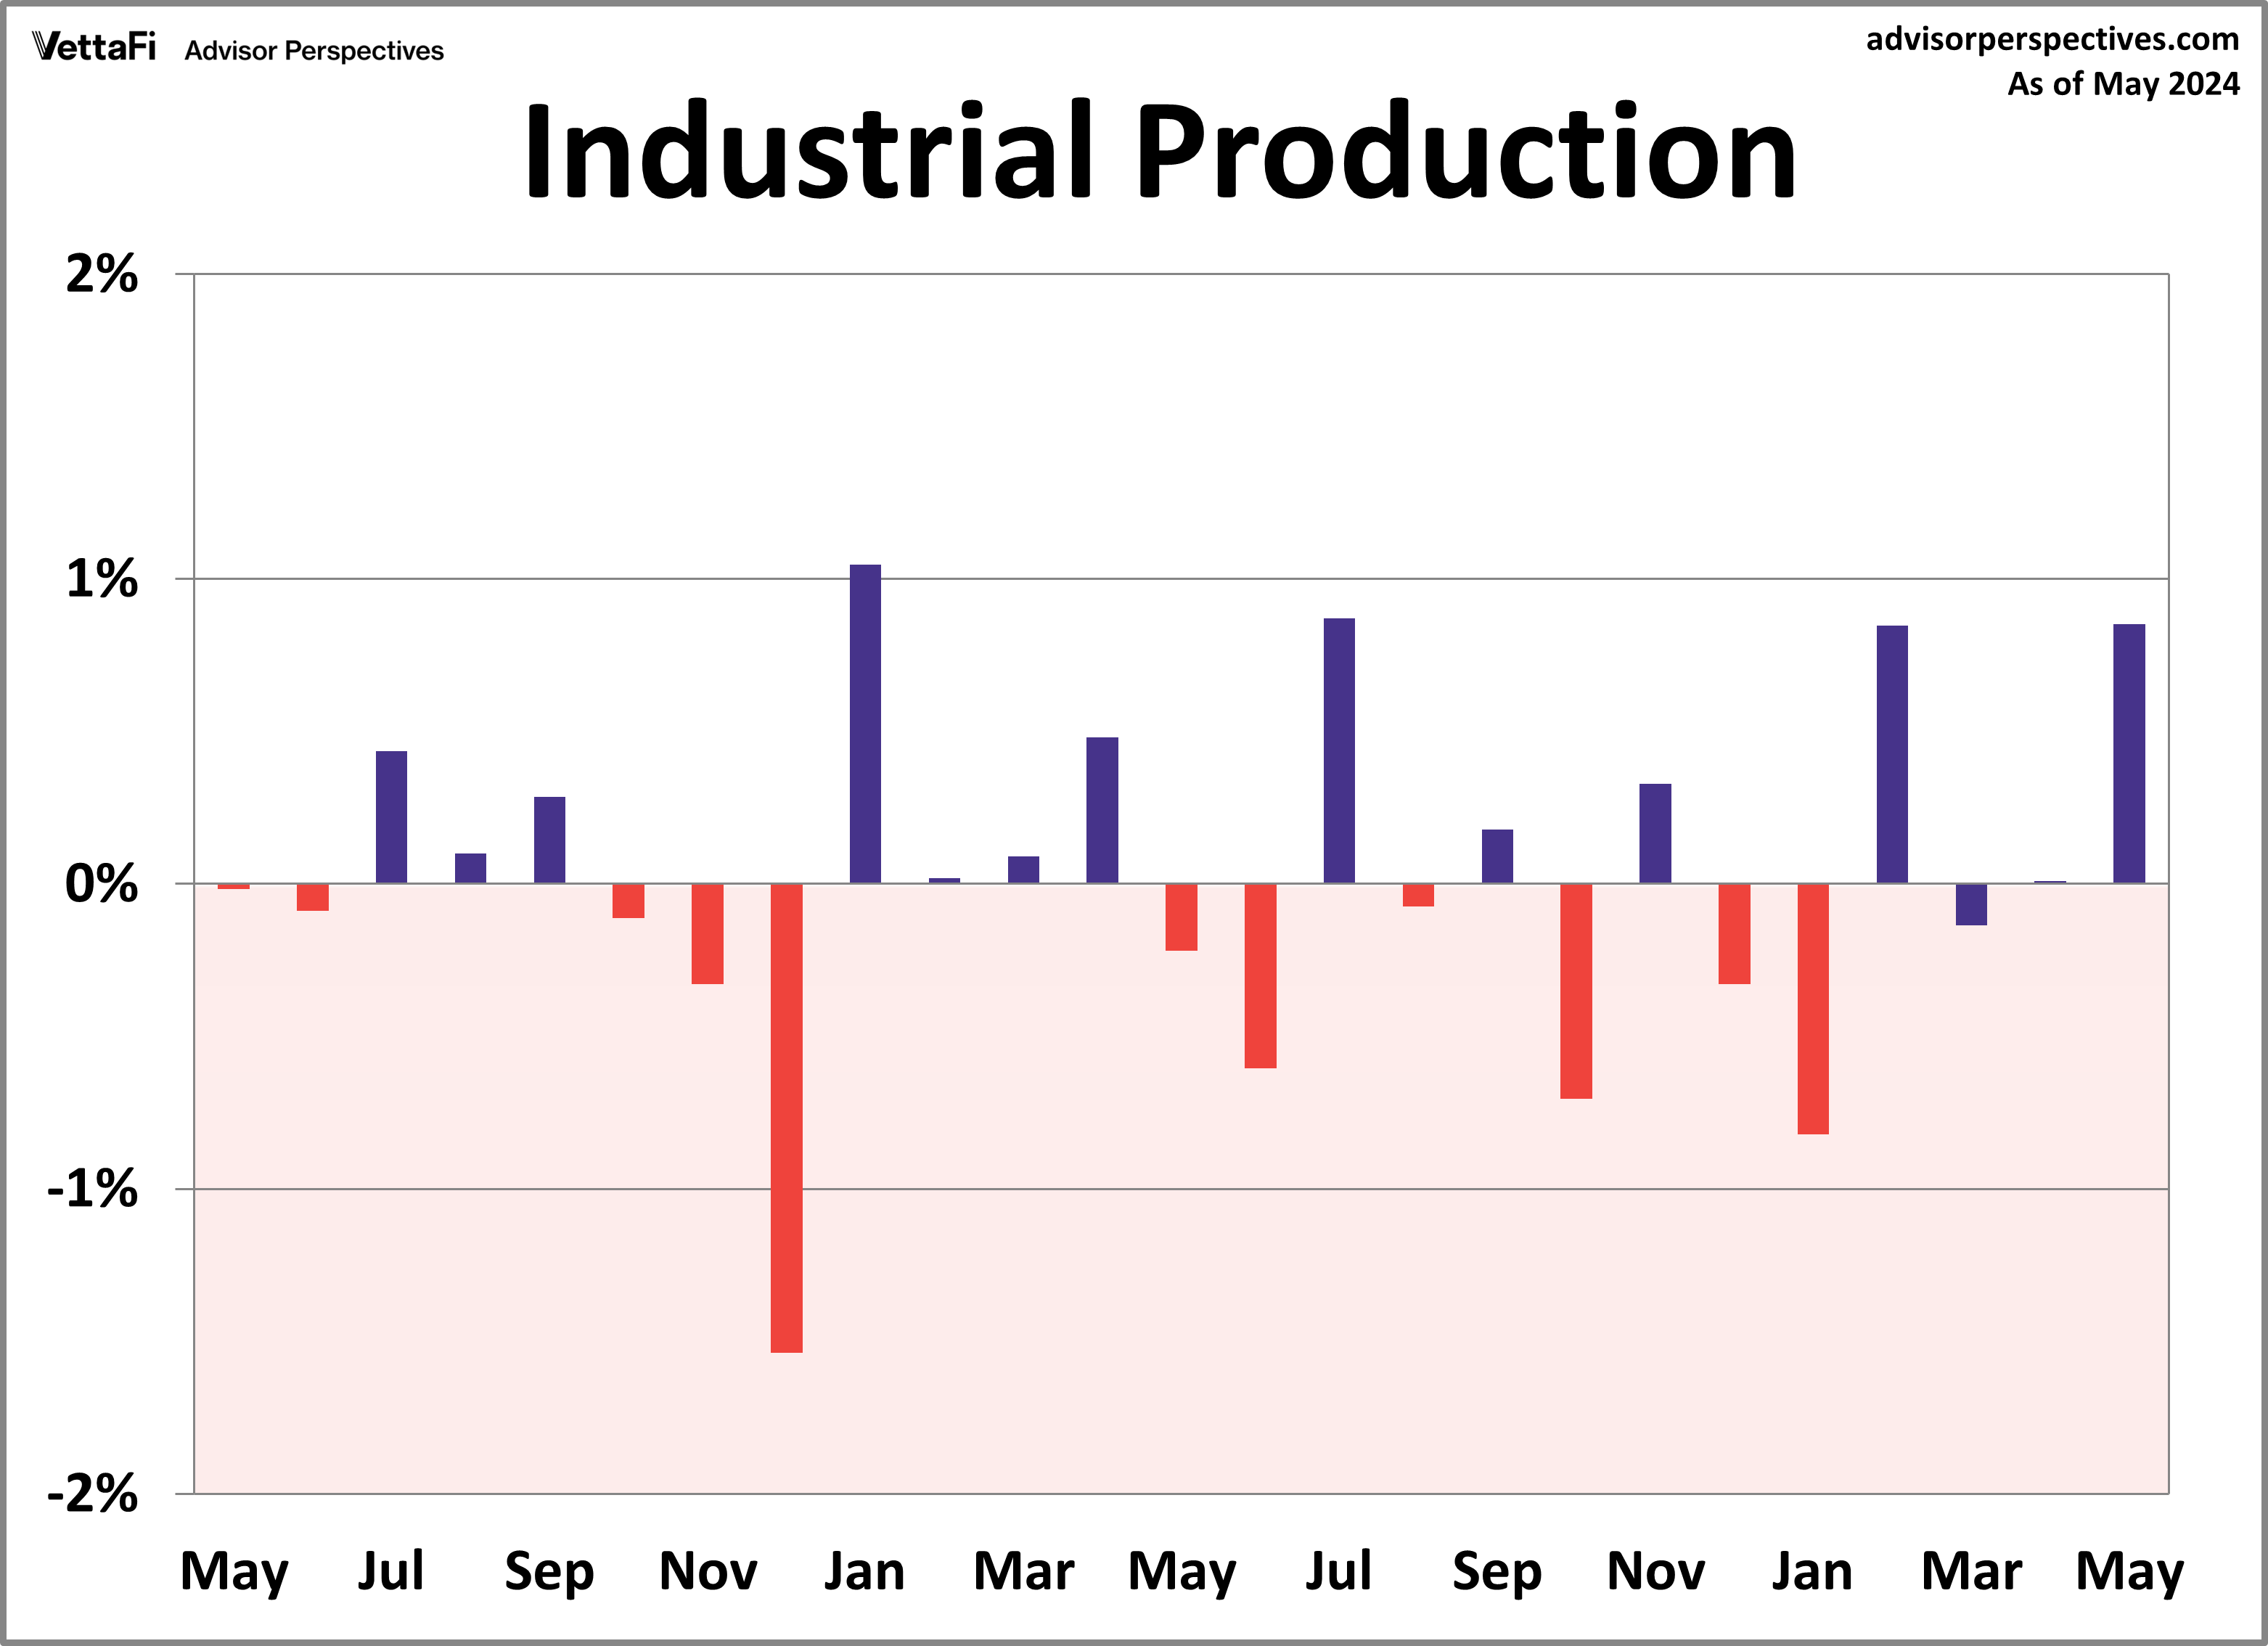
Industrial Production
U.S. factory output increased to its highest level in over 1.5 years last month. Industrial production rose 0.9% in May, outpacing the 0.3% projected growth. A breakdown of the index reveals that last month’s growth can be largely attributed to two sectors: manufacturing and utilities. Manufacturing output rose 0.9% in May while output of utilities surged 1.6%. Compared to one year ago, industrial production was up 0.39%. That marked the highest year-over-year growth of 2024.
Capacity utilization, which measures the amount of slack in the economy by comparing current production output to its maximum potential output, also increased last month. The latest reading of the capacity utilization index was up 0.7% from the previous month to 78.7. That surpassed the 78.6 forecast. In addition to showing cycles of economic growth and demand, capacity utilization also serves as a leading indicator of inflation. That makes it a closely monitored measure of economic health.
Industrial production will have an impact on the interest in the Industrial Select Sector SPDR Fund (XLI).
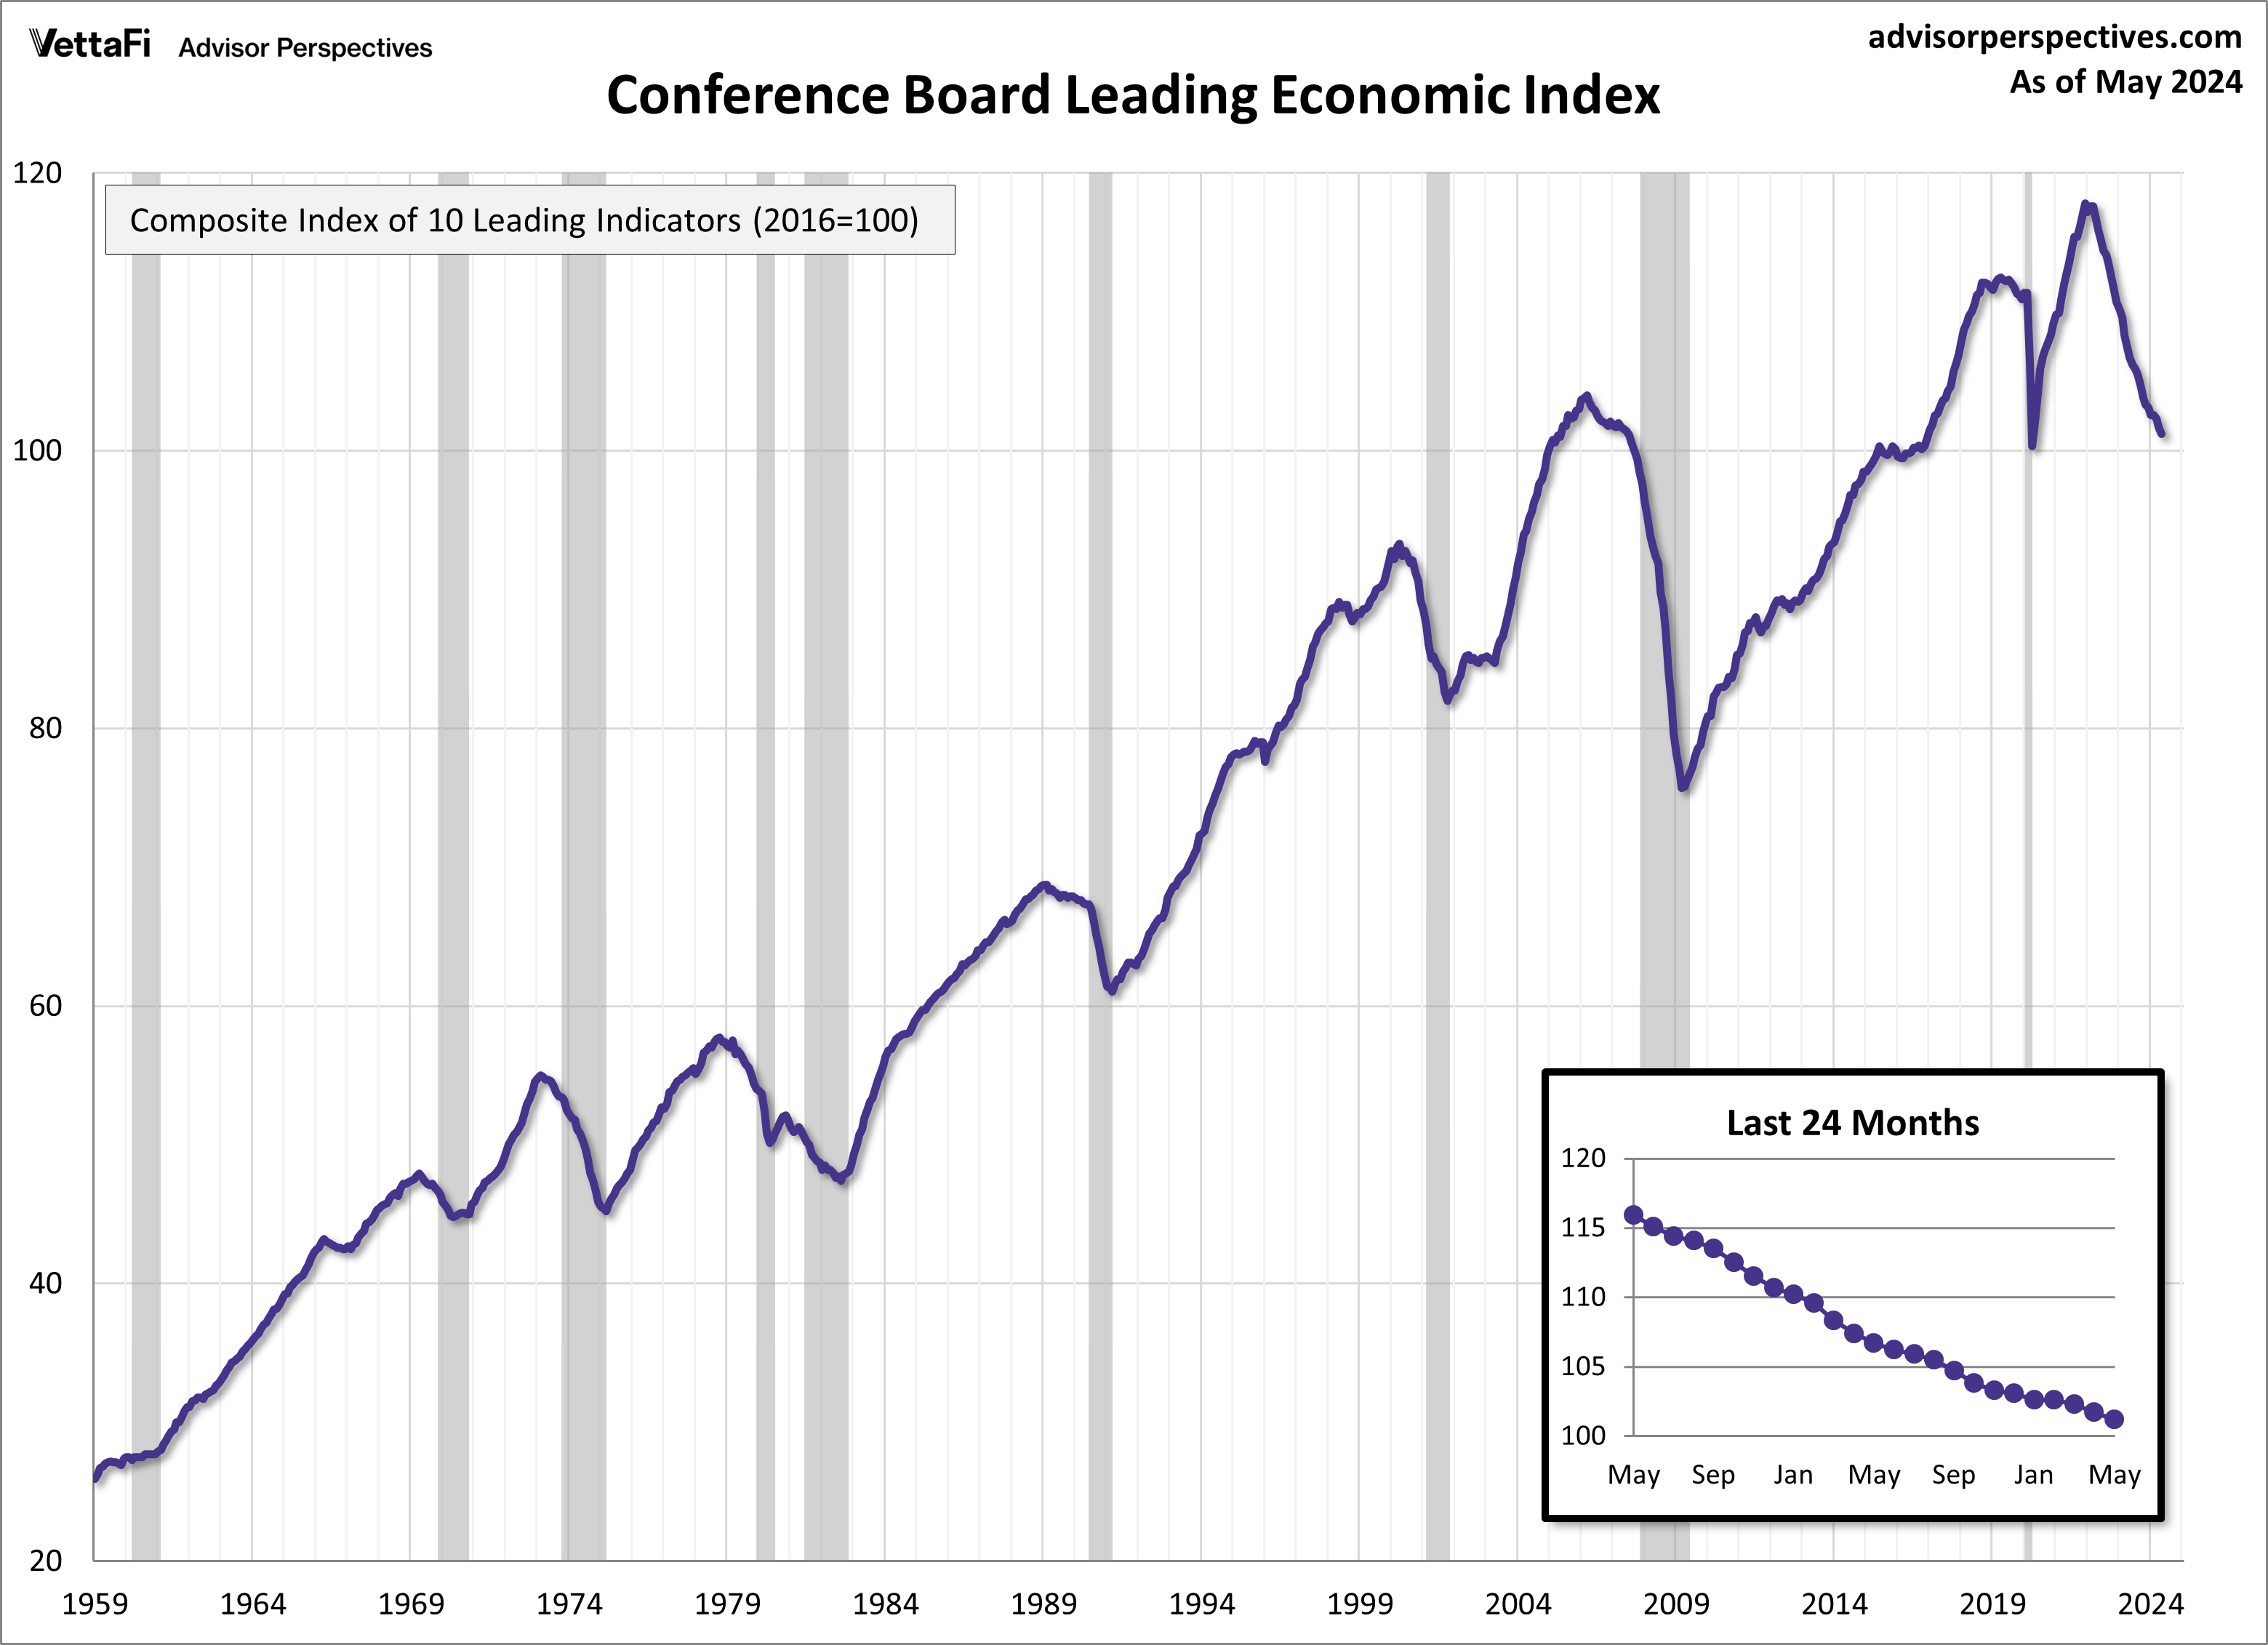
Leading Economic Index
The Conference Board Leading Economic Index (LEI), a composite index designed to predict the economy’s trajectory, is currently not signaling a recession despite falling even further last month. In May, the LEI fell 0.5% to 101.2 — its lowest level since April 2020. The index has now declined or been flat for 26 straight months. A breakdown of the latest report showed that six of the index’s 10 components made negative contributions. The largest declines came from consumer expectations for business conditions, new orders, and building permits. The Conference Board was on record for predicting a recession using its LEI for all of last year. But it has recently updated its forecast to reflect no recession taking place. But the board believes economic growth will continue to slow for the back half of the year.
Economic Indicators and the Week Ahead
The upcoming week will offer insights into the nation’s economic climate, particularly in terms of consumption and consumer attitudes.
On Tuesday, the Conference Board will post May’s reading on its Consumer Confidence Index. Consumer confidence, which could impact the Consumer Discretionary Select Sector SPDR ETF (XLY), improved for the first time in four months last month as strong labor market views bolstered consumers’ overall assessment.
On Thursday, the Bureau of Economic Analysis (BEA) will release the final estimate of Q1 GDP. As a reminder, last month the initial estimate of 1.6% was revised lower to 1.3%.
On Friday, the BEA will publish May’s PCE price index data, the Fed’s preferred measure of inflation. Headline and core PCE have slowly trended downward toward the Fed’s 2% target rate over the past few years but have stagnated over recent months, with the latest readings at 2.7% and 2.8%, respectively.
For more news, information, and analysis, visit the Innovative ETFs Channel.