
This article provides an update on the monthly moving averages we track for the S&P 500 and the Ivy Portfolio after the close of the last business day of the month.
The Ivy Portfolio
The Ivy Portfolio is based on the asset allocation strategy used by endowment funds from Harvard and Yale. It is an equally weighted portfolio constructed with 5 ETFs that feature a mix of different asset classes. By allocating across different asset classes, diversification is achieved, and risk is reduced. The different asset classes and their corresponding ETFs are below.
- Domestic stocks, represented by Vanguard Total Stock Market ETF (VTI)
- International stocks, represented by Vanguard FTSE All-World ex-US Index Fund (VEU)
- Bonds, represented by iShares 7-10 Year Treasury Bond ETF (IEF)
- Real estate, represented by Vanguard Real Estate ETF (VNQ)
- Commodities, represented by Invesco DB Commodity Index Tracking Fund (DBC)
The process of using the Ivy Portfolio is quite simple. First, compose a diversified portfolio from each of the major asset classes held in equal weight (see above). Then, compute a moving average of closing prices over the prior 10 months for each fund (or desired time frame). Lastly, observe the portfolio at the end of each month (note that for the advance preview we are observing the portfolio after the close on the 2nd to last business day of each month). If a fund closes out the month below the level of its moving average, sell it and hold cash, repurchasing only when it closes back above its moving average at the end of any subsequent month. Similarly, if a fund closes out the month above the moving average, hold it.
For a fascinating analysis of the Ivy portfolio strategy, see this article by Adam Butler, Mike Philbrick, and Rodrigo Gordillo: Faber’s Ivy Portfolio: As Simple as Possible, But No Simpler.
The Ivy Portfolio: Latest Data
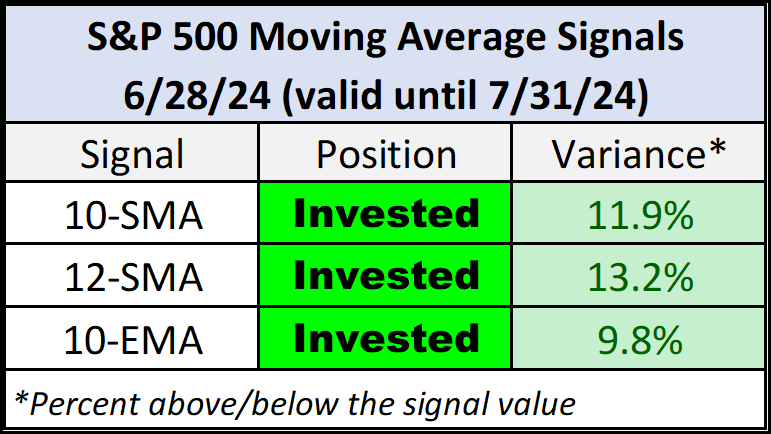
The table below shows the 10-month simple moving average (SMA) timing signal for the five asset classes highlighted in the Ivy Portfolio. At the end of June, none of the five Ivy Portfolio ETFS closed below their 10-month SMA. This is unchanged from last month’s final no “cash” signal.
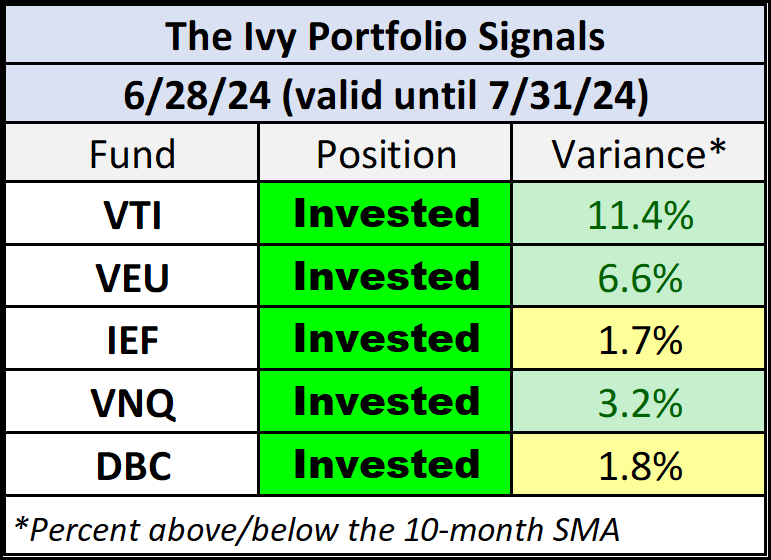
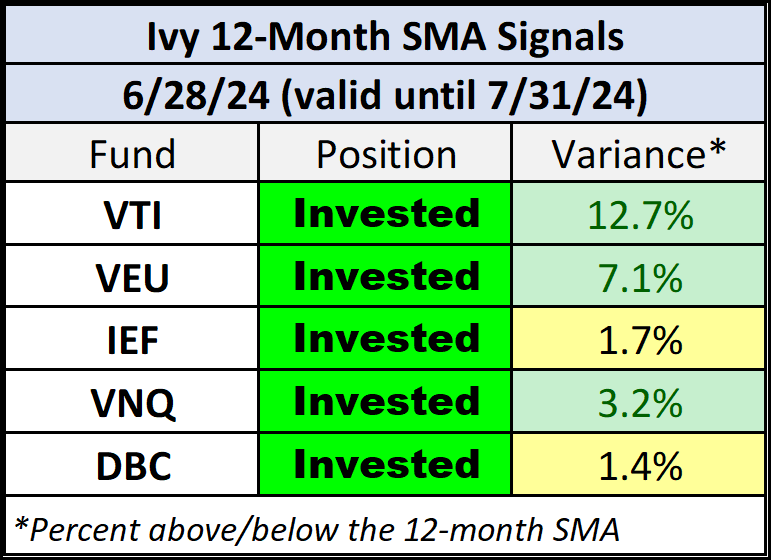
The tables also show the percentage above or below the moving average for each fund. If a position is less than 2% from a signal, it is highlighted in yellow to put a bit more emphasis on those funds that are close to reversing positions.
For a slightly longer time frame, the next table shows the 12-month simple moving average (SMA) timing signals for the Ivy Portfolio ETFs. At the end of June, none of the five Ivy Portfolio ETFS closed below their 12-month SMA. This is unchanged from last month’s final no “cash” signal.
The S&P 500 and Moving Averages
The S&P 500 closed June with a monthly gain of 3.46%, after a gain of 4.80% in May. But let’s examine the index through the lens of moving averages.
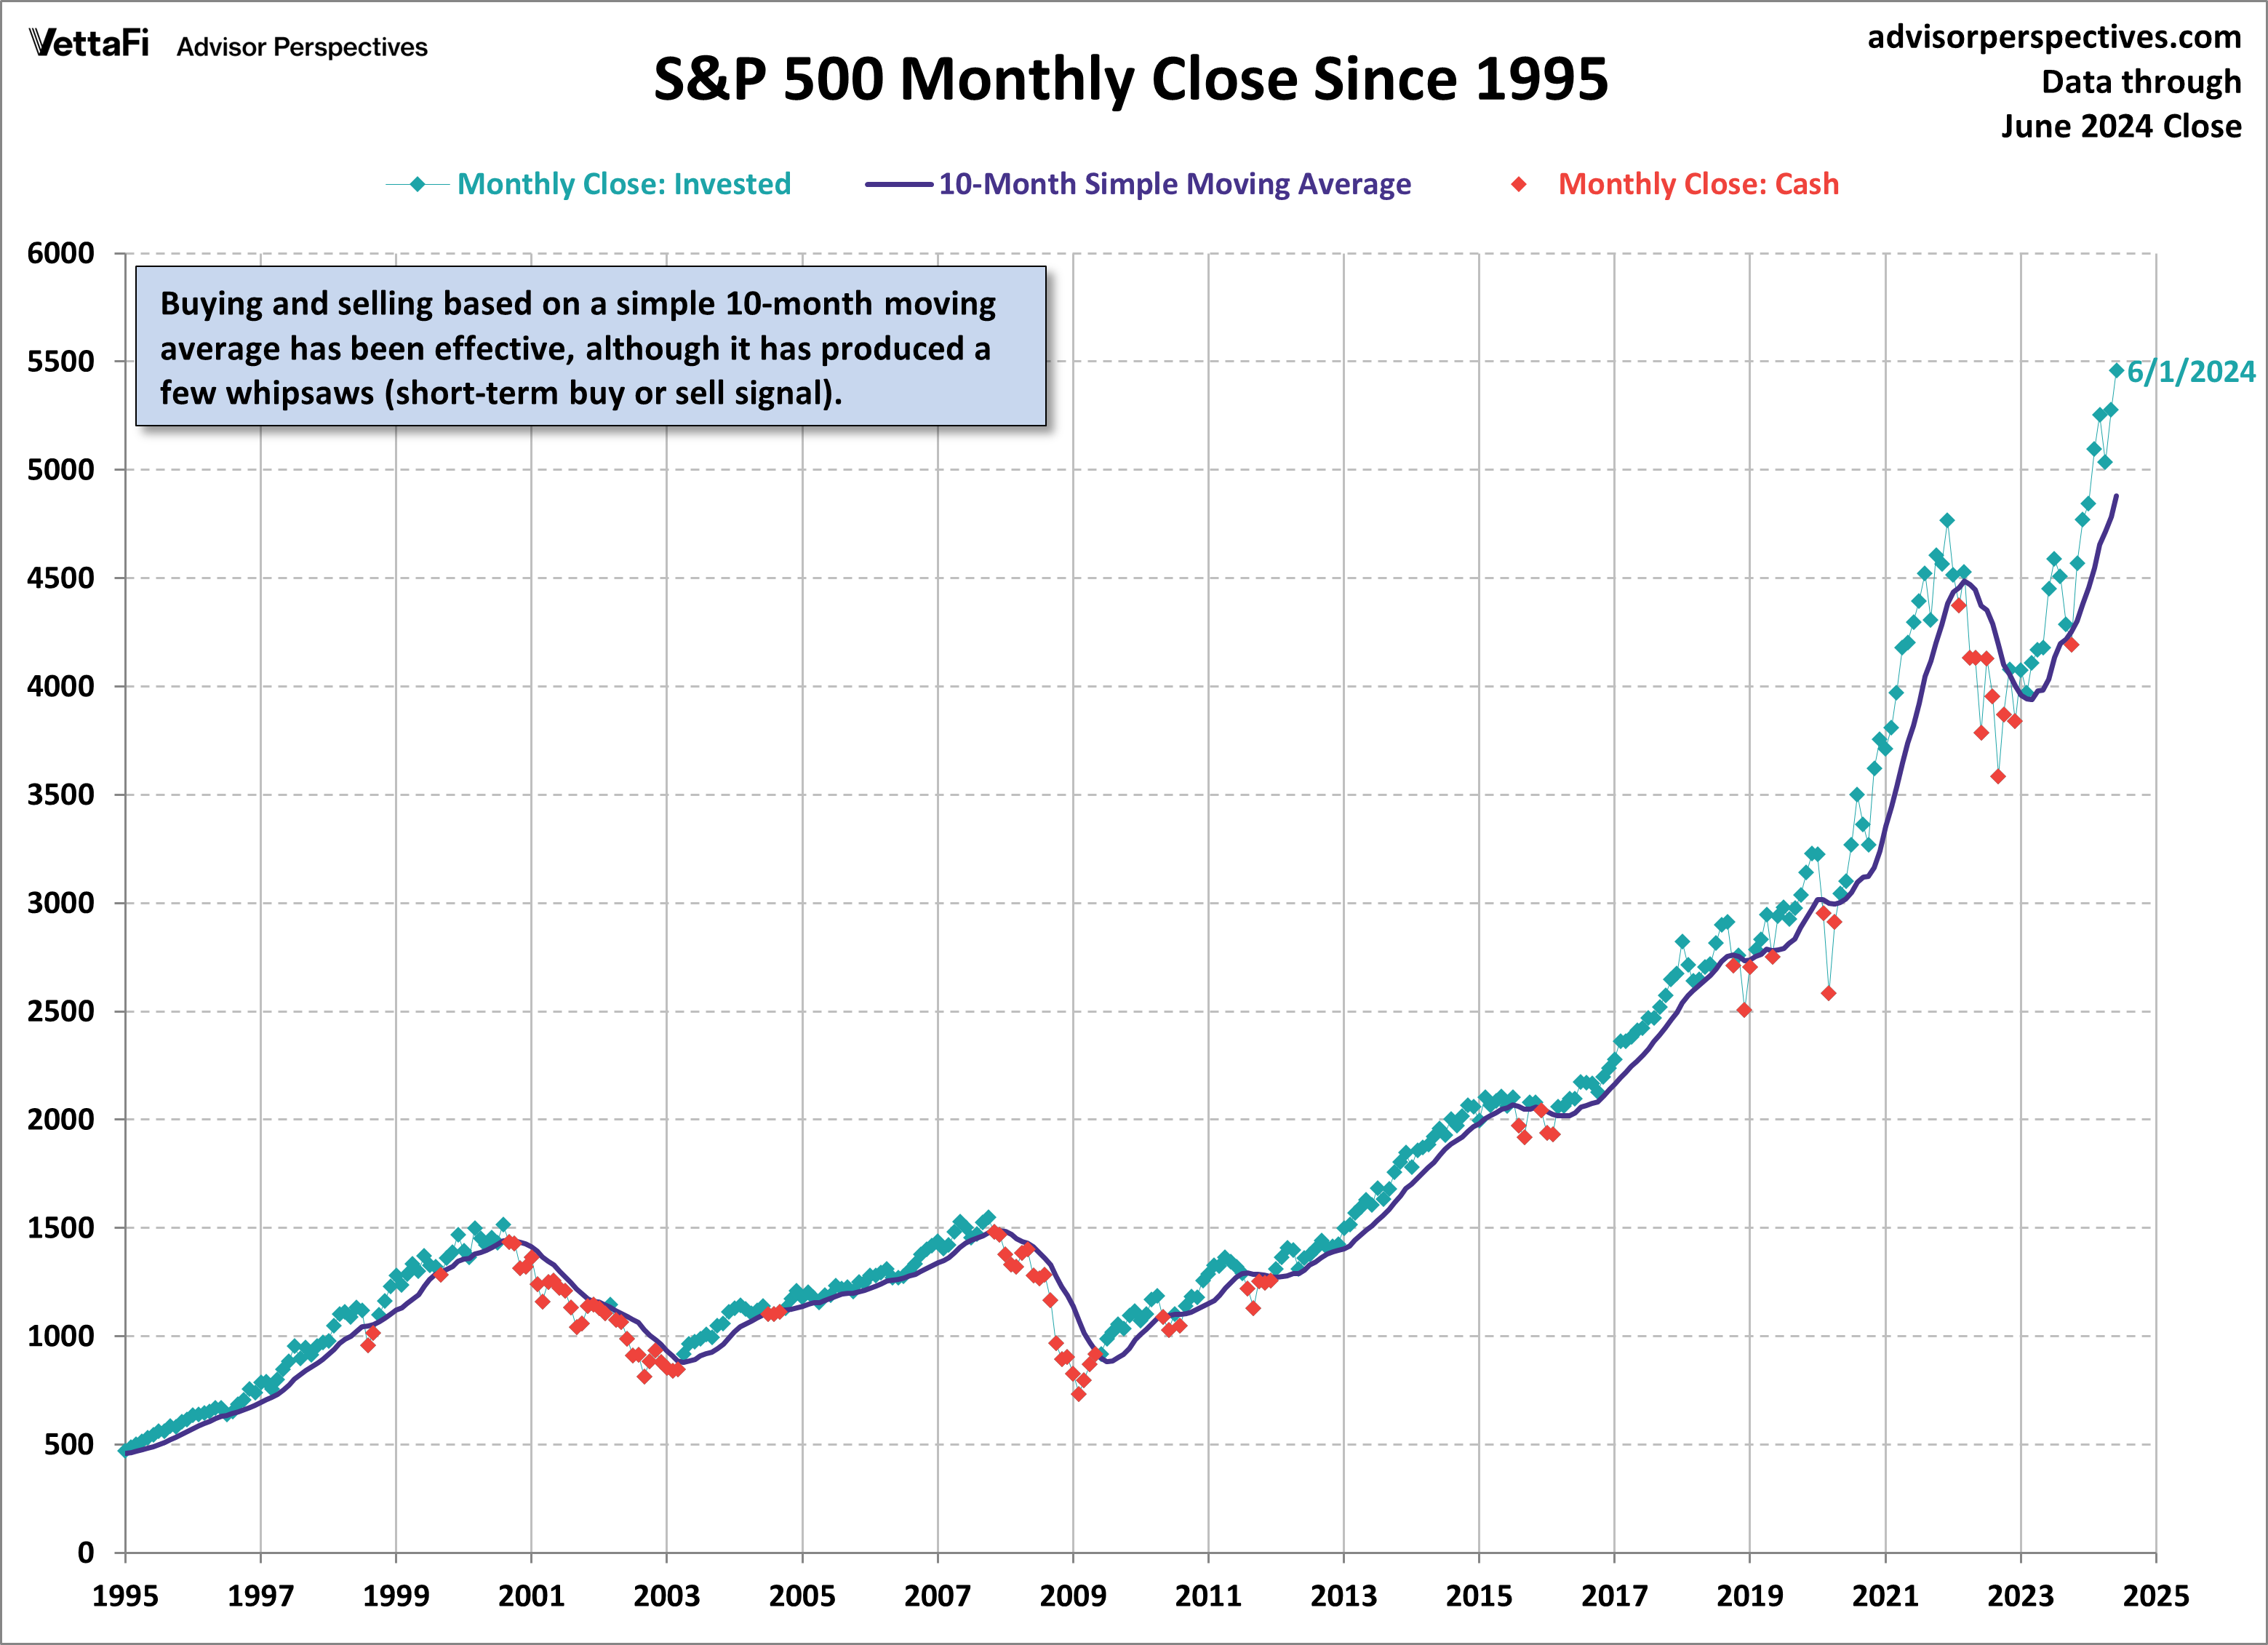
Buying and selling based on a moving average of monthly closes can be an effective strategy for managing the risk of severe loss from major bear markets. In essence, when the monthly close of the index is above the moving average value, you hold the index. When the index closes below, you move to cash. The disadvantage is that it never gets you out at the top or back in at the bottom. Also, it can produce the occasional whipsaw (short-term buy or sell signal), which was seen most recently in 2020.
Nevertheless, a 10- or 12-month simple moving average (SMA) strategy would have ensured participation in most of the upside price movement since 1995 while dramatically reducing losses. For confirmation, here is a chart of the S&P 500 monthly closes since 1995 with a 10-month SMA.
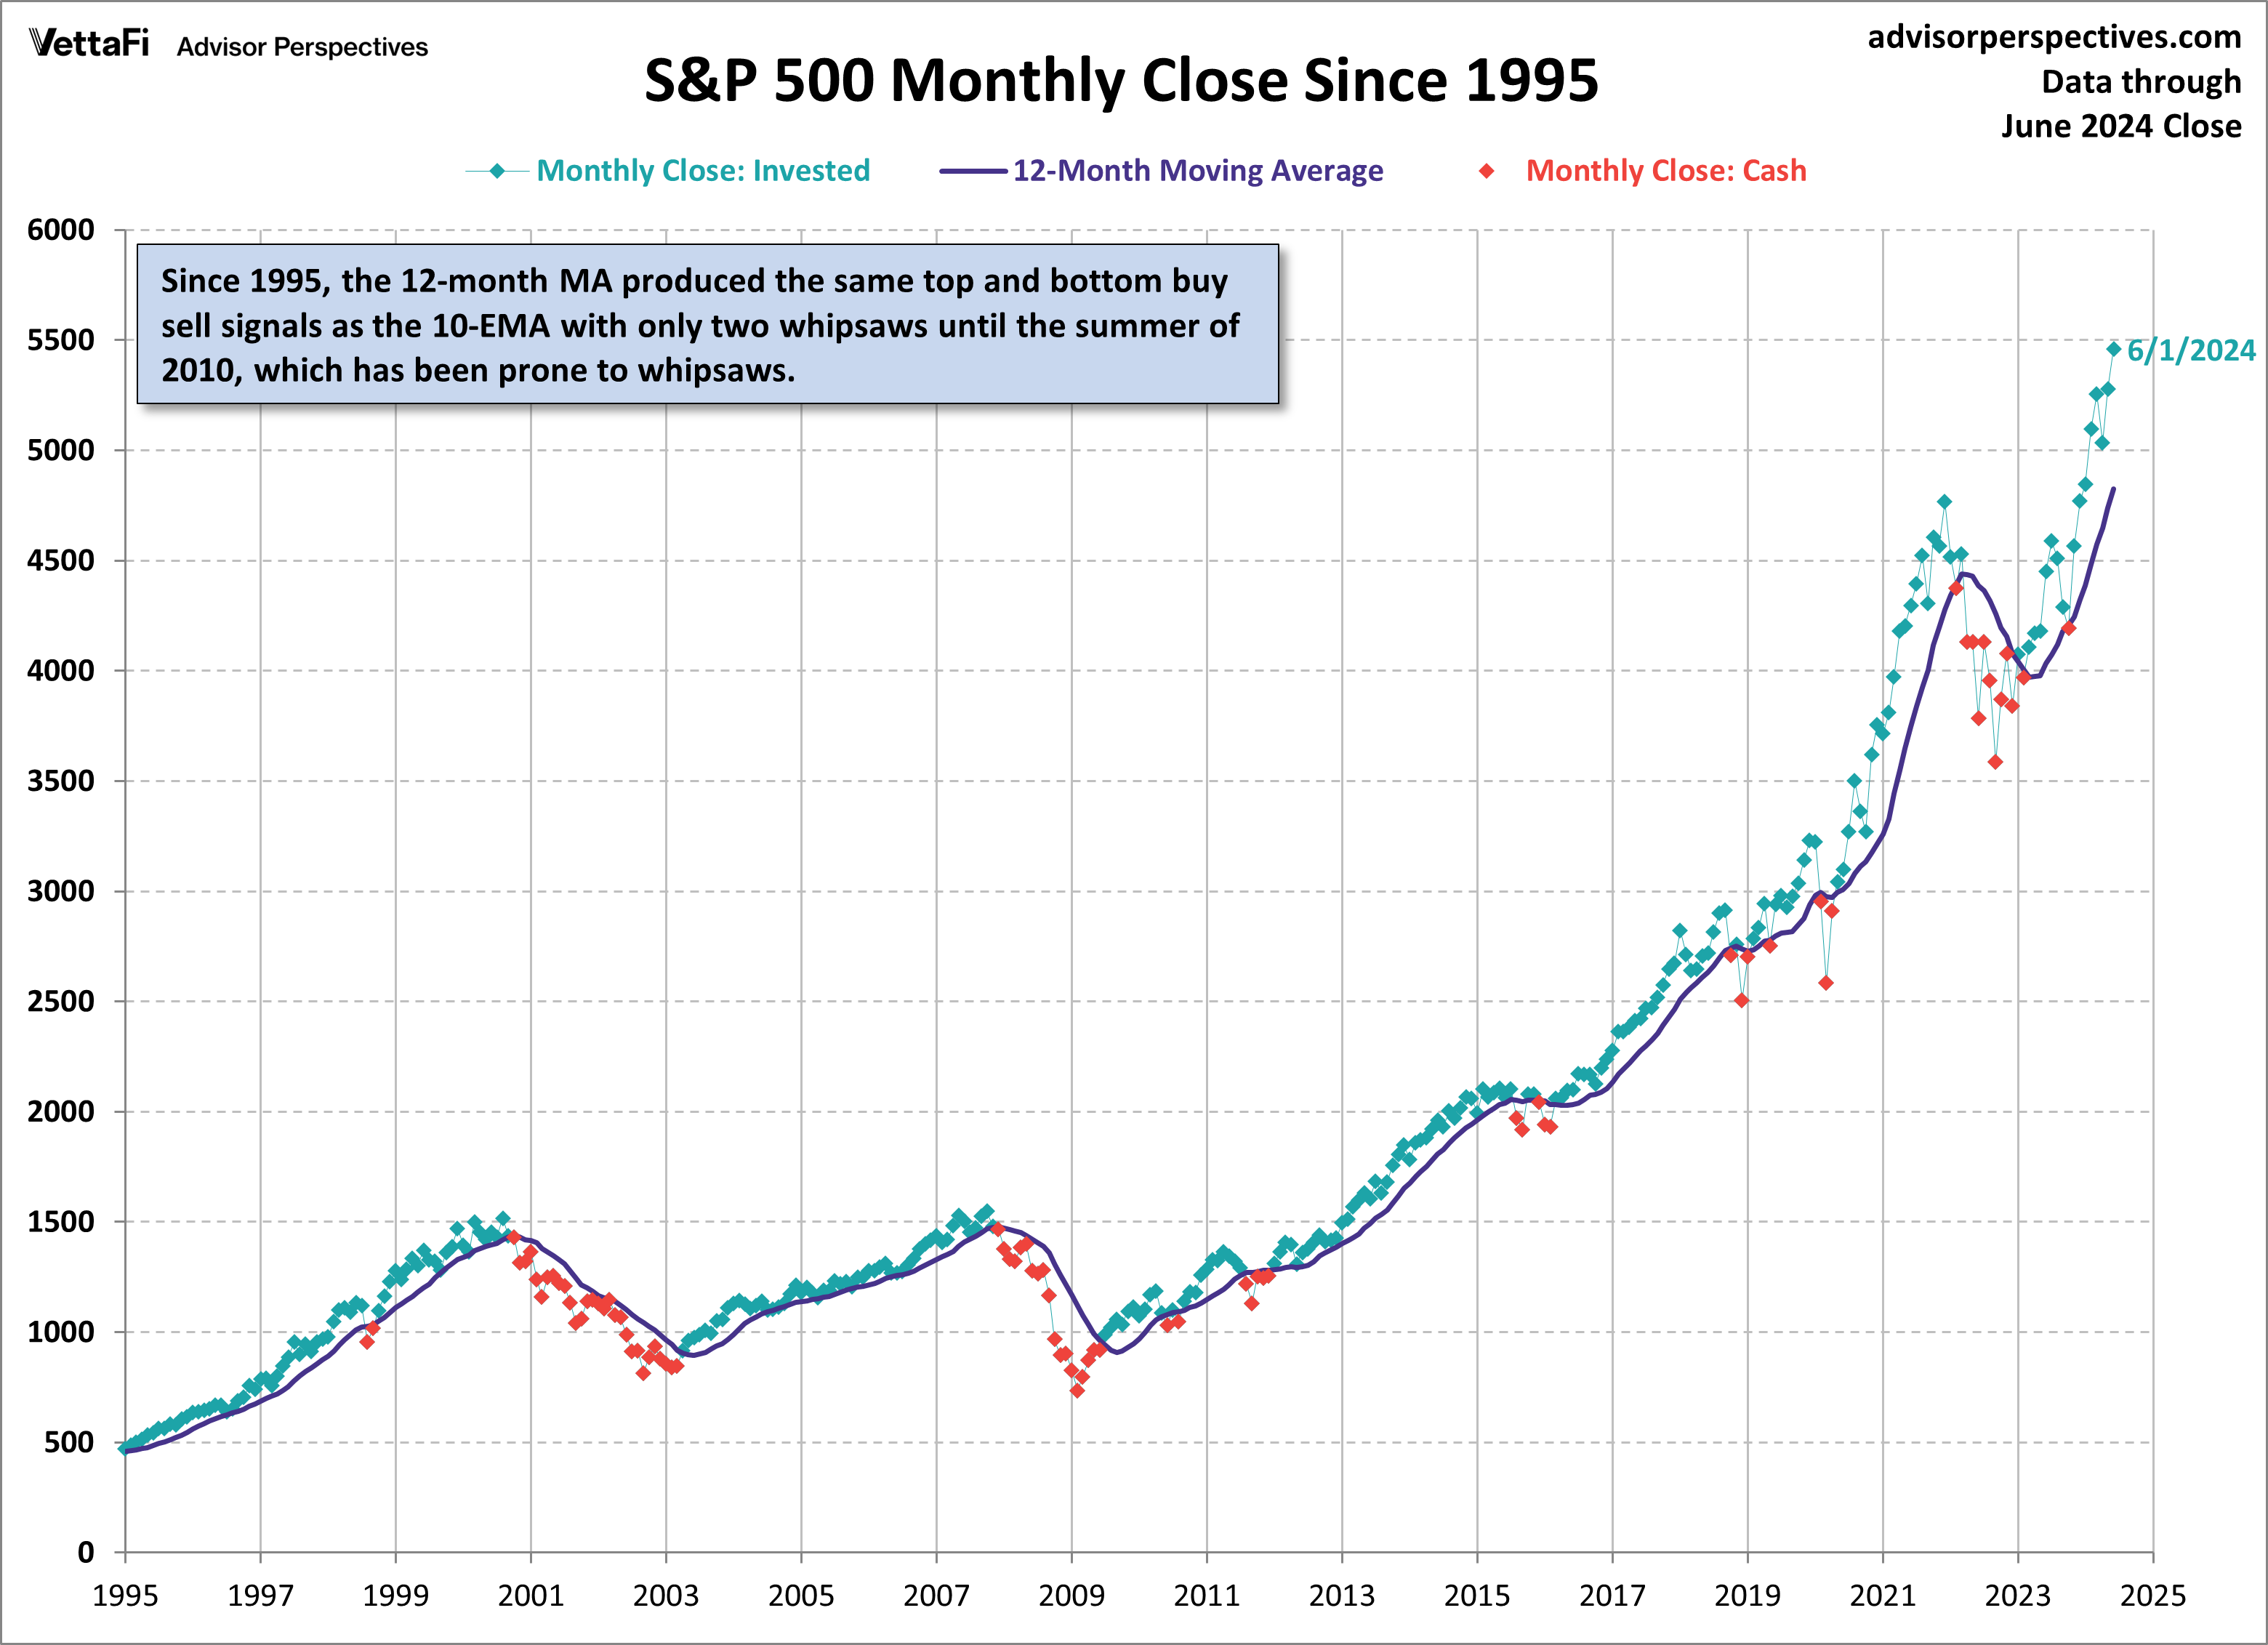
To further demonstrate, the next chart uses the 12-month variant. By using 12-months instead of 10, the moving average becomes slightly less volatile. Still, we can see that this is just as, if not more, effective in reducing losses.
The next chart uses one more variation to the moving average strategy. The chart shows the 10-month exponential moving average (EMA), which is a slight variant to the simple approach used in the previous two charts. This version mathematically increases the weighting of newer data in the 10-month sequence. Since 1995 it has produced fewer whipsaws than the equivalent simple moving average. However, it was one month slower to signal a “sell” after the two market tops in 2000 and 2007.
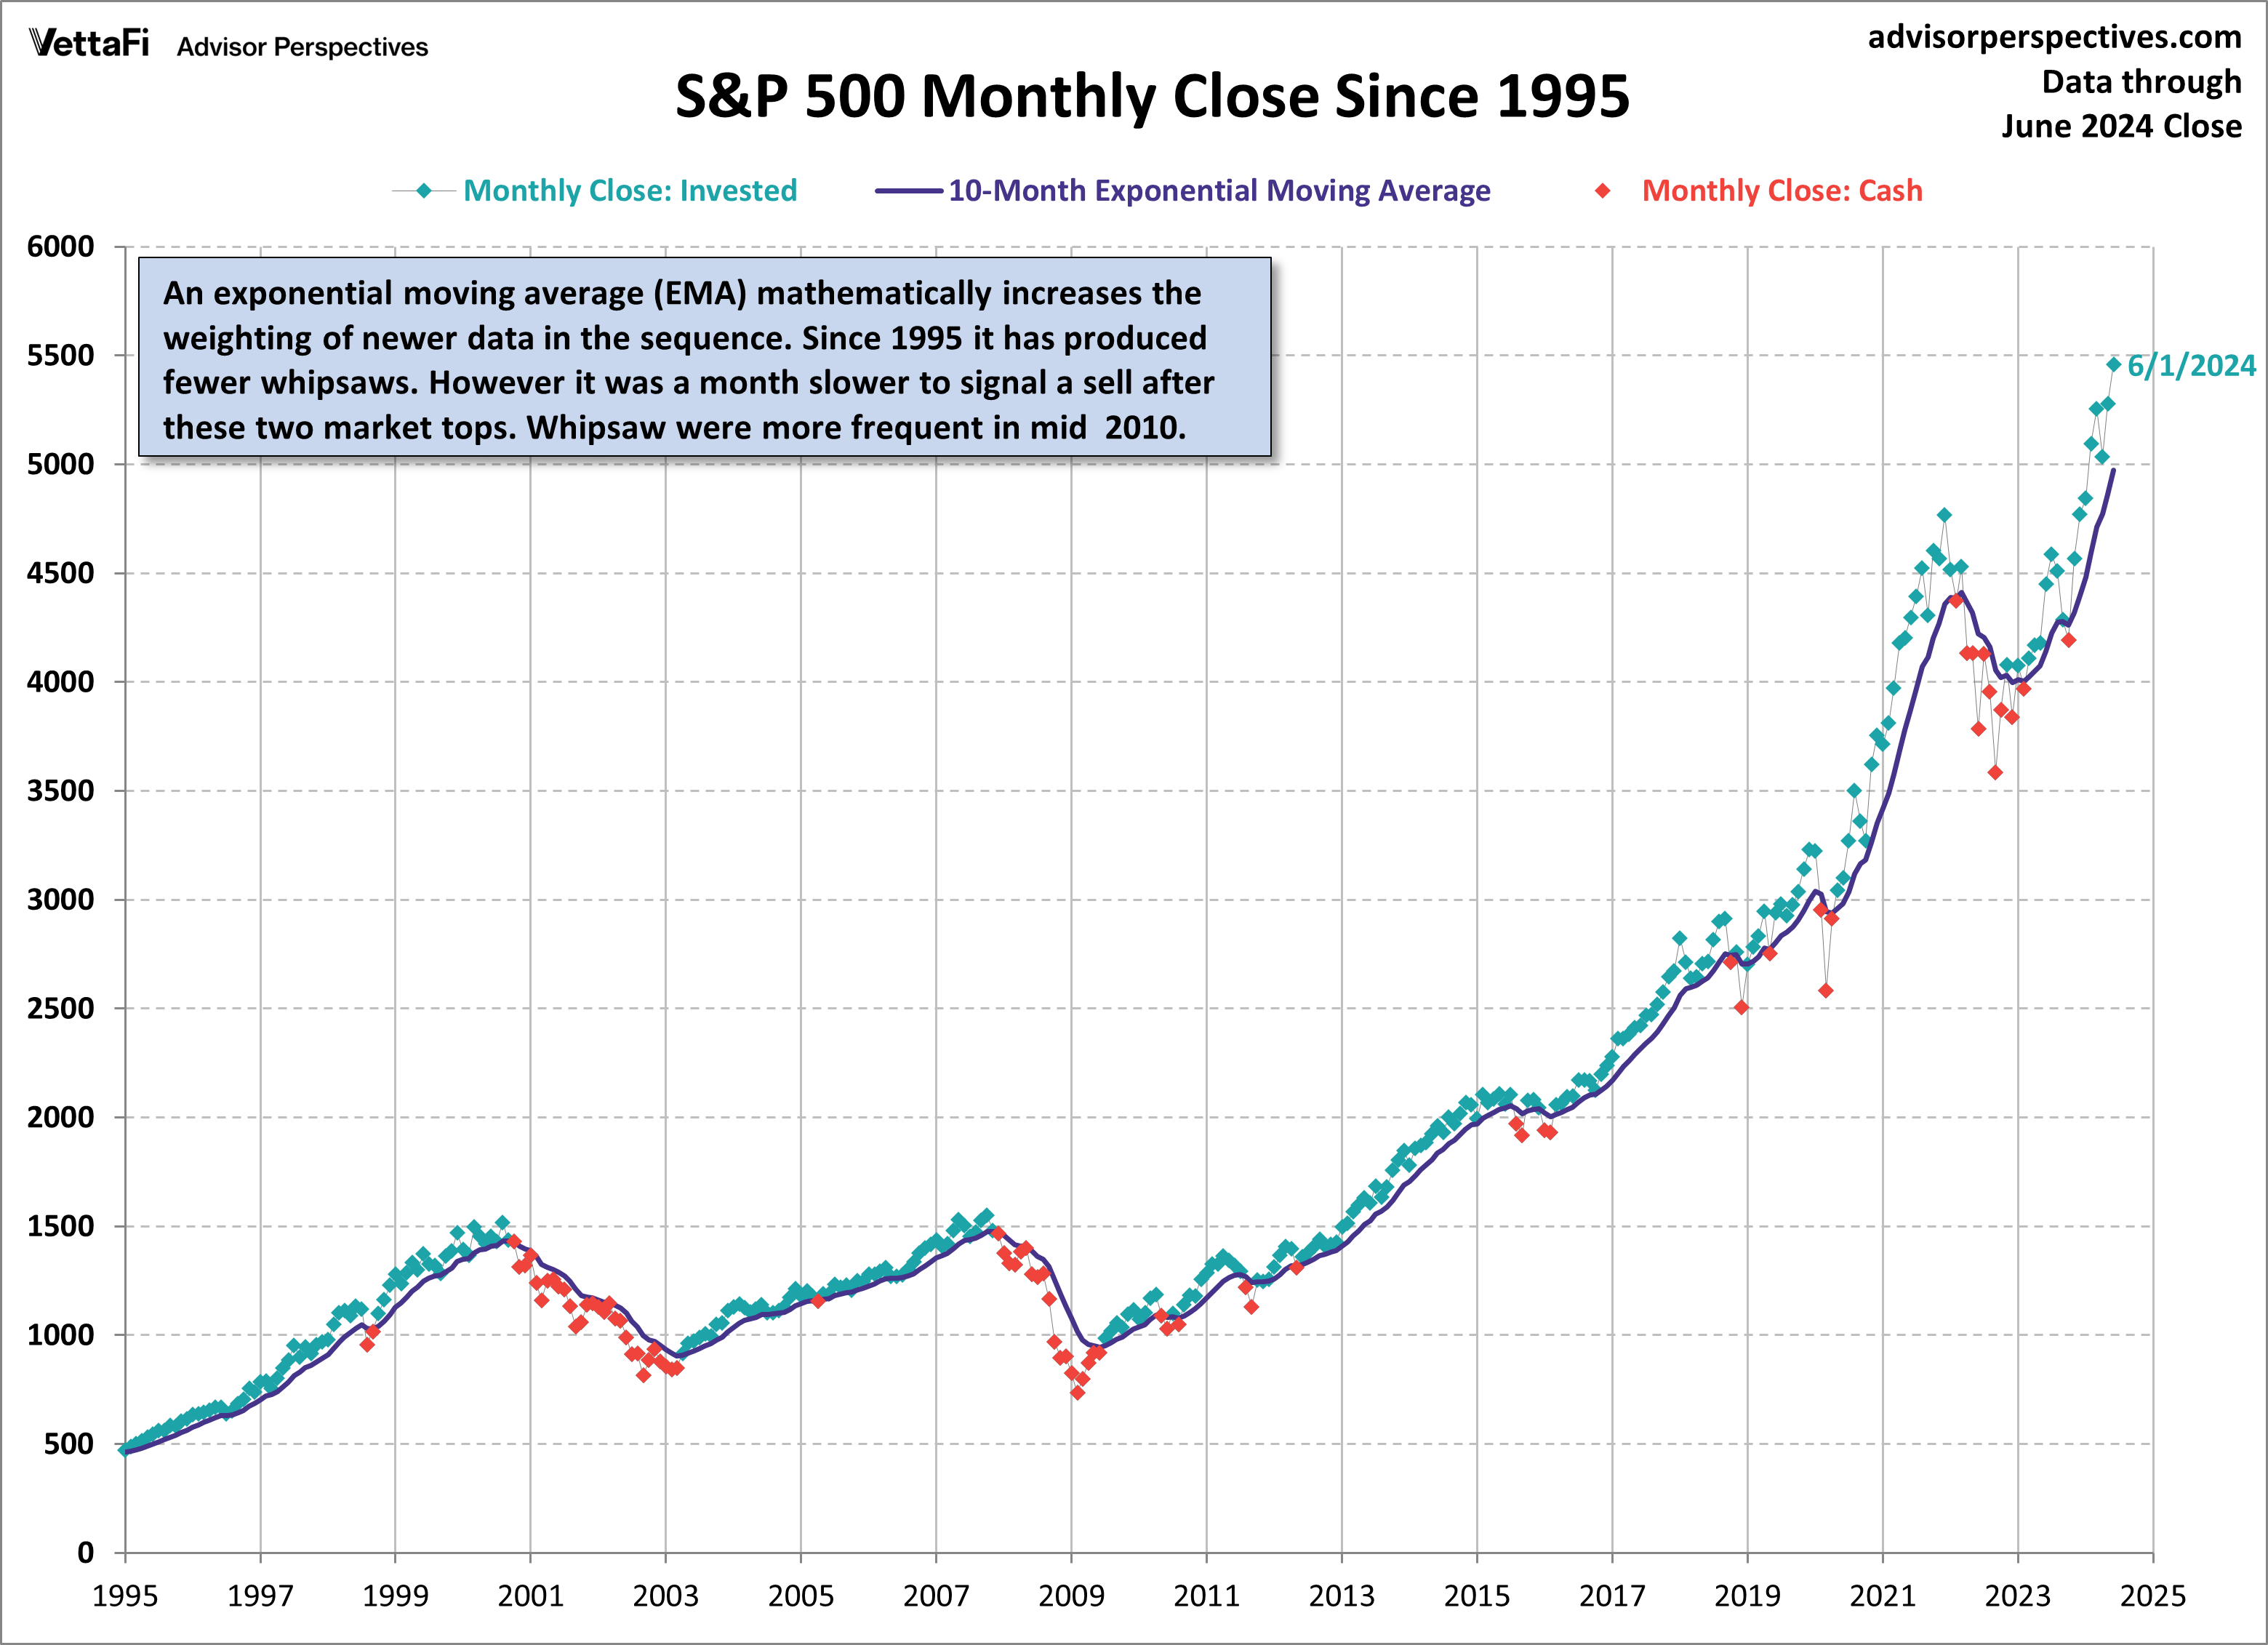
To summarize, all three approaches flashed a hold signal at the end of June since they are all above their respective moving averages.
Moving Averages Effectiveness
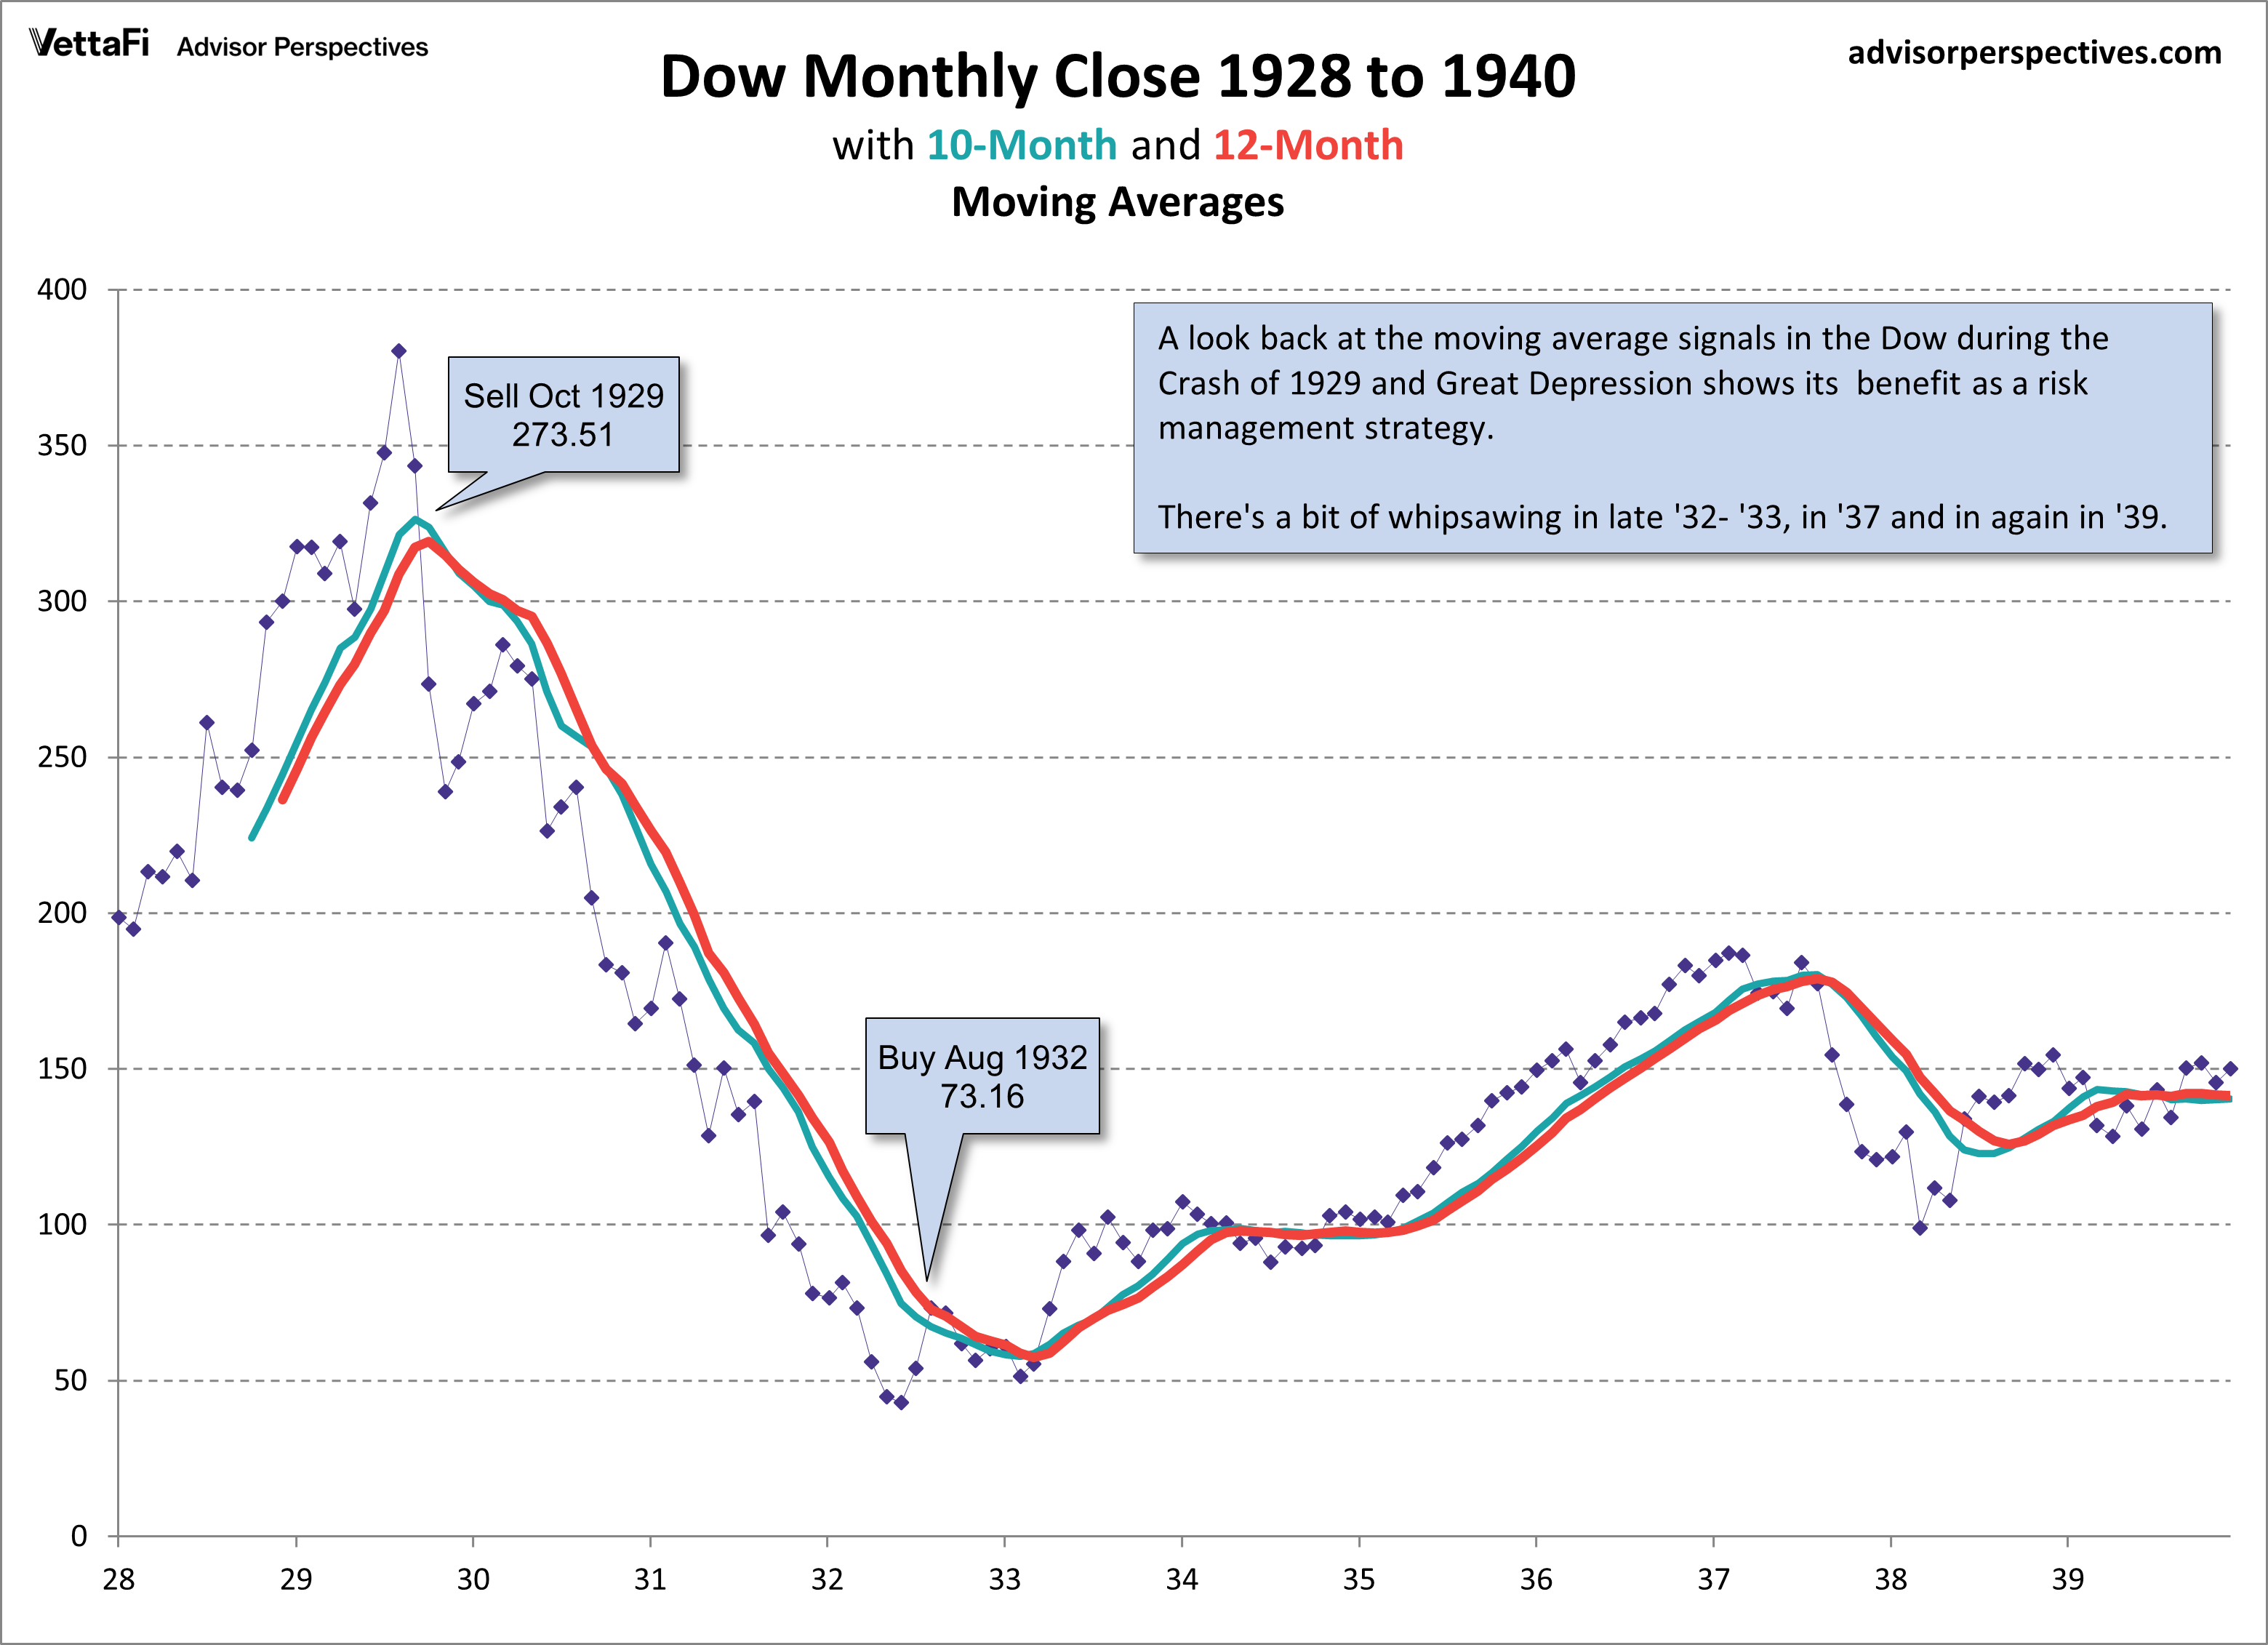
A look back at the 10- and 12-month moving averages in the Dow during the Crash of 1929 and Great Depression shows the effectiveness of these strategies during those dangerous times.
The Psychology of Momentum Signals
Timing works because of a basic human trait. People imitate successful behavior. When they hear of others making money in the market, they buy in. Eventually, the trend reverses. It may be merely the normal expansions and contractions of the business cycle. Sometimes the cause is more dramatic — an asset bubble, a major war, a pandemic, or an unexpected financial shock. When the trend reverses, successful investors sell early. The imitation of success gradually turns the previous buying momentum into selling momentum.
Implementing the Moving Averages Strategy
Our illustrations from the S&P 500 are just that — illustrations. We use the S&P 500 because of the extensive historical data that’s readily available and the index signals give a general sense of how U.S. equities are behaving. However, followers of a moving average strategy should make buy/sell decisions on the signals for each specific investment, not a broad index. Even if you’re investing in a fund that tracks the S&P 500 (e.g., Vanguard’s VFINX or the SPY ETF) the moving average signals for the funds will occasionally differ from the underlying index because of dividend reinvestment. The S&P 500 numbers in our illustrations exclude dividends.
The strategy is most effective in a tax-advantaged account with a low-cost brokerage service. You want the gains for yourself, not your broker or your Uncle Sam.
Valid until the market close on July 31, 2024.
As a regular feature of this website, we update the signals at the end of each month.
Note: For anyone who would like to see the 10- and 12-month simple moving averages in the S&P 500 and the equity-versus-cash positions since 1950, click here for an Excel file (xlsx format) of the data. Our source for the monthly closes (Column B) is Yahoo! Finance. Columns D and F show the positions signaled by the month-end close for the two SMA strategies.
Footnote on calculating monthly moving averages: If you’re making your own calculations of moving averages for dividend-paying stocks or ETFs, you will occasionally get different results if you don’t adjust for dividends. For example, in 2012 VNQ remained invested at the end of November based on adjusted monthly closes, but there was a sell signal if you ignored dividend adjustments. Because the data for earlier months will change when dividends are paid, you must update the data for all the months in the calculation if a dividend was paid since the previous monthly close. This will be the case for any dividend-paying stocks or funds.