Thought to ponder …
“You never change things by fighting the existing reality. To change something, build a new model that makes the existing model obsolete.
— Vishen Lakhiani, “The Buddha and the Badass”
The View from 30,000 feet

Click to enlarge
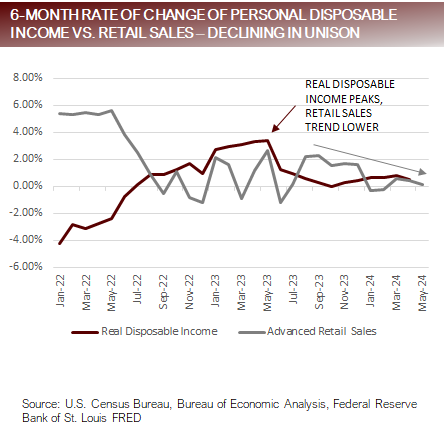
Retail Sales: No longer being propped up by rising Real Disposable Income
- Retail Sales surprised to the downside, with weakness centered around:
- Furniture & home furnishings -1%
- Building materials & garden equip -8%
- Food & beverage stores -2%
- Gasoline -2%
- Food service & drinking places -4%
- Much of the current decrease in the headline Retail Sales number can be attributed to the decline in gasoline prices at the pump, which have fallen about 6% since April.
- Retail Sales may face headwinds going forward. Real Disposable Income is down from an annual change of 5.3% to 1.0% between June of 2023 and the most recent release from April 2024. The downward momentum in Real Disposable Income, combined with government subsidized pandemic savings being exhausted and tighter credit standards, is leaving consumers with less available discretionary income.
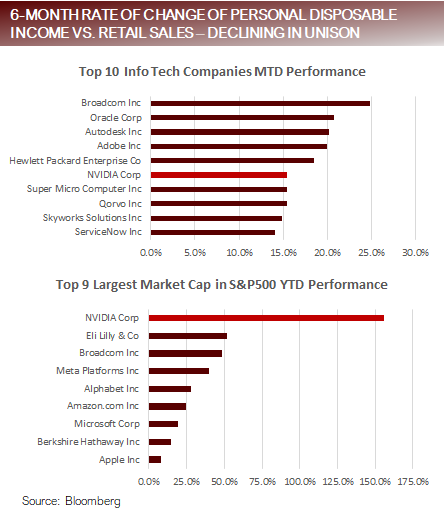
Nvidia’s newest milestone – largest market cap in the S&P500
- One of the major headlines of the week was “concentration”, as it applies to not only Nvidia but to the entire tech sector.
-
- The S&P500 was up 55% MTD as of the close on Friday. Only two sectors outperformed the S&P500 this month, Info Tech, which was up 8.68%, and Consumer Discretionary, which was up 3.77%.
-
- As of the close on Friday the S&P500 was up 57% YTD. The top five companies (Microsoft, Apple, Nvidia, Google and Amazon) together combined attribution was 14.69%, over 100% of the return of the S&P500 for the year. The average gain of the top five companies YTD was 47.20%.
-
- Nvidia alone has accounted for 65% of the gain of the S&P500 this year, and Google accounting for 17% of the gain of the S&P500 for the year.
-
- There are 129 companies in the S&P500 trading with a YTD gain higher than the Index, with an average gain of 29.85%.
-
- There are 196 companies in the S&P500 trading with a loss on the year, with an average loss of -11.16%.
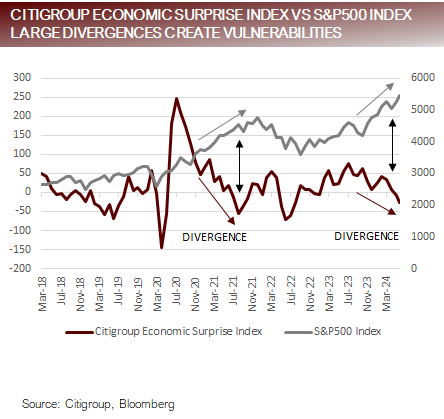
Economic surprises diverging from equity market performance
- At the end of 2023, Bloomberg consensus economic estimates for GDP growth for the S. was 1.2%. As of the April release of the consensus economists estimates on 4/19/24 the number had doubled to 2.4%. It remained at 2.4% in the June estimates released by Bloomberg on 5/24/24.
- The Citigroup Economic Surprise Index, which measures consensus estimates for economic releases versus actual release data, was near its 2024 peak in mid-April (+40.0 on 4/15/24) when economists upgraded their estimates for the GDP, and has since dropped to -25.6, the lowest level since May of 2022, when the market was in the midst of a major drawdown, down over -16% YTD at the time in 2022.
- Large divergences between high consensus estimates and equity performance tend to mark inflection points because higher equity prices are linked to unexpected data upside, and conversely lower equity prices are linked to unexpected data downside, which becomes increasingly likely when estimates have moved significantly higher.
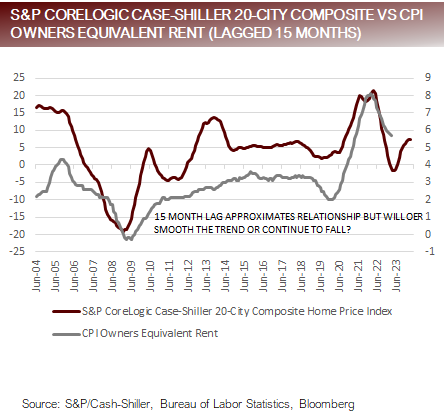
Housing market sounding alarm bells
- This sound of alarm bells ringing out from the housing sector are getting louder each day.
- The National Association of Homebuilders Index dropped to its lowest level of 2024, missing consensus estimates for the third consecutive month.
- Housing Starts fell to their lowest level since June of 2020, during the midst of the pandemic shutdown.
- Building Permits also fell to their lowest level since June of 2020.
- The Redfin Home Buyer demand Index is down -17% year-over-year, at near the lowest level since the pandemic.
- According to Redfin, 6.6% of homes had price drops, the highest percent since the pandemic.
- According to Redfin, Active Listings are up 16.5% year-over-year, with the Monthly Supply of Home Available now at the highest for this time of year since prior to the pandemic.
- Although there is about a 15-month lag between the S&P CoreLogic Case-Shiller 20-City Composite Home Price Index and CPI Owners Equivalent Rent, the rebound in prices that began in spring of 2023 calls into question how quickly OER will fall in the coming months.
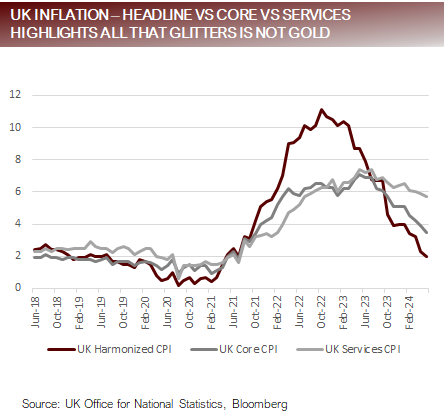
UK inflation highlights complexities
- After becoming the first major economy to reach their inflation target of 2.0% last week, the odds of a rate cut in August for the UK actually went down from 45% to 30%.
- Markets were unable to celebrate the good news because both services inflation and core inflation, surprised on the upside and are still significantly above targets.
- Headline inflation meeting expectations while core missing highlights the complexities of facing central banks as they grapple with policy tools ill equipped to address inflation.
- High interest rates in the UK have a more dramatic impact on consumers because 26% of people in the UK have floating rate mortgages, as compared to the US, where only 4% of people do.
- The UK’s relatively smaller economy also is more likely to be manipulated by smaller events, such as the Taylor Swift Affect, which is estimated adding as much as 30 bps to service inflation due to hotel room prices, making policy decisions more difficult.
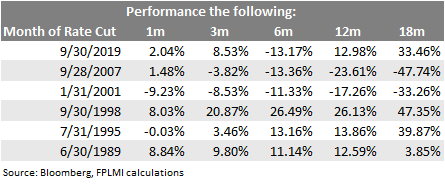
SPECIAL TOPIC: Equity market moves after the first rate cut
- The table provided below shows S&P500 Index performance measured the ending month of the first rate cut over the next 1m, 3m, 6m 12m and 18m.
- There are no easy answers Some generalizations:
- Equity markets tend to hold up relatively well in most instances in the near-term following a rate cut.
- Beyond three months, the picture begins to get cloudier, with potential for large swings up or down depending on how severe the economic damage was that initiated the rate cut.
- Bottom line
- Central banks cut rates because growth is in In some cases, cutting rates is enough to head the trouble off at the pass, in others, it requires a combination of lower rates, a fiscal response and time, lots of time, to recover new highs.
Putting it all together
- In the larger picture, inflation is easing across most of the developed world. The path of disinflation has not been, and will not be, without twists and turns, with some areas being more persistently inflationary than others, but the general trend for inflation is
- In the US, housing and auto/auto related inflation have been the big sticking points not willing to cooperate with the disinflationary trends, but even those are showing signs of weakness, as housing numbers deteriorate, and data has shown that new cars are beginning to pile up on lots. This likely means disinflationary pressures will continue in the US, which will ultimately lead to rate cuts this
- Although the markets are exuberant about rate cuts, wishing for rate cuts is a mixed bag because it depends on the degree of softening in the economy that motivated the rate cuts as to what they mean for asset
- Our house view is that the economy will continue to be strong as long as the consumer holds The two biggest factors impacting consumers are the labor and housing markets. Material deterioration in either will cause the consumer to pull back in spending, risking setting off a cascade of events that will lead to lower earnings. We don’t see signs of this happening in the near-term but would highlight that, if they happen, these developments will manifest in the data which should be carefully heeded, and investors would be wise not to hold onto their opinions in opposition of the data if/when conditions start to change.
For more news and information, visit the Innovative ETFs Channel.
DISCLOSURES AND IMPORTANT RISK INFORMATION
Performance data quoted represents past performance, which is not a guarantee of future results. No representation is made that a client will, or is likely to, achieve positive returns, avoid losses, or experience returns similar to those shown or experienced in the past.
Focus Point LMI LLC
For more information, please visit www.focuspointlmi.com or contact us at [email protected] Copyright 2024, Focus Point LMI LLC. All rights reserved.
The text, images and other materials contained or displayed on any Focus Point LMI LLC Inc. product, service, report, e-mail or web site are proprietary to Focus Point LMI LLC Inc. and constitute valuable intellectual property and copyright. No material from any part of any Focus Point LMI LLC Inc. website may be downloaded, transmitted, broadcast, transferred, assigned, reproduced or in any other way used or otherwise disseminated in any form to any person or entity, without the explicit written consent of Focus Point LMI LLC Inc. All unauthorized reproduction or other use of material from Focus Point LMI LLC Inc. shall be deemed willful infringement(s) of Focus Point LMI LLC Inc. copyright and other proprietary and intellectual property rights, including but not limited to, rights of privacy. Focus Point LMI LLC Inc. expressly reserves all rights in connection with its intellectual property, including without limitation the right to block the transfer of its products and services and/or to track usage thereof, through electronic tracking technology, and all other lawful means, now known or hereafter devised. Focus Point LMI LLC Inc. reserves the right, without further notice, to pursue to the fullest extent allowed by the law any and all criminal and civil remedies for the violation of its rights.
All unauthorized use of material shall be deemed willful infringement of Focus Point LMI LLC Inc. copyright and other proprietary and intellectual property rights. While Focus Point LMI LLC will use its reasonable best efforts to provide accurate and informative Information Services to Subscriber, Focus Point LMI LLC but cannot guarantee the accuracy, relevance and/or completeness of the Information Services, or other information used in connection therewith. Focus Point LMI LLC, its affiliates, shareholders, directors, officers, and employees shall have no liability, contingent or otherwise, for any claims or damages arising in connection with (i) the use by Subscriber of the Information Services and/or (ii) any errors, omissions or inaccuracies in the Information Services. The Information Services are provided for the benefit of the Subscriber. It is not to be used or otherwise relied on by any other person. Some of the data contained in this publication may have been obtained from The Federal Reserve, Bloomberg Barclays Indices; Bloomberg Finance L.P.; CBRE Inc.; IHS Markit; MSCI Inc. Neither MSCI Inc. nor any other party involved in or related to compiling, computing or creating the MSCI Inc. data makes any express or implied warranties or representations with respect to such data (or the results to be obtained by the use thereof), and all such parties hereby expressly disclaim all warranties of originality, accuracy, completeness, merchantability or fitness for a particular purpose with respect to any of such data. Such party, its affiliates and suppliers (“Content Providers”) do not guarantee the accuracy, adequacy, completeness, timeliness or availability of any Content and are not responsible for any errors or omissions (negligent or otherwise), regardless of the cause, or for the results obtained from the use of such Content. In no event shall Content Providers be liable for any damages, costs, expenses, legal fees, or losses (including lost income or lost profit and opportunity costs) in connection with any use of the Content. A reference to a particular investment or security, a rating or any observation concerning an investment that is part of the Content is not a recommendation to buy, sell or hold such investment or security, does not address the suitability of an investment or security and should not be relied on as investment advice.
This communication reflects our analysts’ current opinions and may be updated as views or information change. Past results do not guarantee future performance. Business and market conditions, laws, regulations, and other factors affecting performance all change over time, which could change the status of the information in this publication. Using any graph, chart, formula, model, or other device to assist in making investment decisions presents many difficulties and their effectiveness has significant limitations, including that prior patterns may not repeat themselves and market participants using such devices can impact the market in a way that changes their effectiveness. Focus Point LMI LLC believes no individual graph, chart, formula, model, or other device should be used as the sole basis for any investment decision. Focus Point LMI LLC or its affiliated companies or their respective shareholders, directors, officers and/or employees, may have long or short positions in the securities discussed herein and may purchase or sell such securities without notice. Neither Focus Point LMI LLC nor the author is rendering investment, tax, or legal advice, nor offering individualized advice tailored to any specific portfolio or to any individual’s particular suitability or needs. Investors should seek professional investment, tax, legal, and accounting advice prior to making investment decisions. Focus Point LMI LLC’s publications do not constitute an offer to sell any security, nor a solicitation of an offer to buy any security. They are designed to provide information, data and analysis believed to be accurate, but they are not guaranteed and are provided “as is” without warranty of any kind, either express or implied.
FOCUS POINT LMI LLC DISCLAIMS ANY AND ALL EXPRESS OR IMPLIED WARRANTIES, INCLUDING, BUT NOT LIMITED TO, ANY WARRANTIES OF MERCHANTABILITY, SUITABILITY OR FITNESS FOR A PARTICULAR PURPOSE OR USE.
Focus Point LMI LLC, its affiliates, officers, or employees, and any third-party data provider shall not have any liability for any loss sustained by anyone who has relied on the information contained in any Focus Point LMI LLC publication, and they shall not be liable to any party for any direct, indirect, incidental, exemplary, compensatory, punitive, special or consequential damages, costs, expenses, legal fees, or losses (including, without limitation, lost income or lost profits and opportunity costs) in connection with any use of the information or opinions contained Focus Point LMI LLC publications even if advised of the possibility of such damages.