
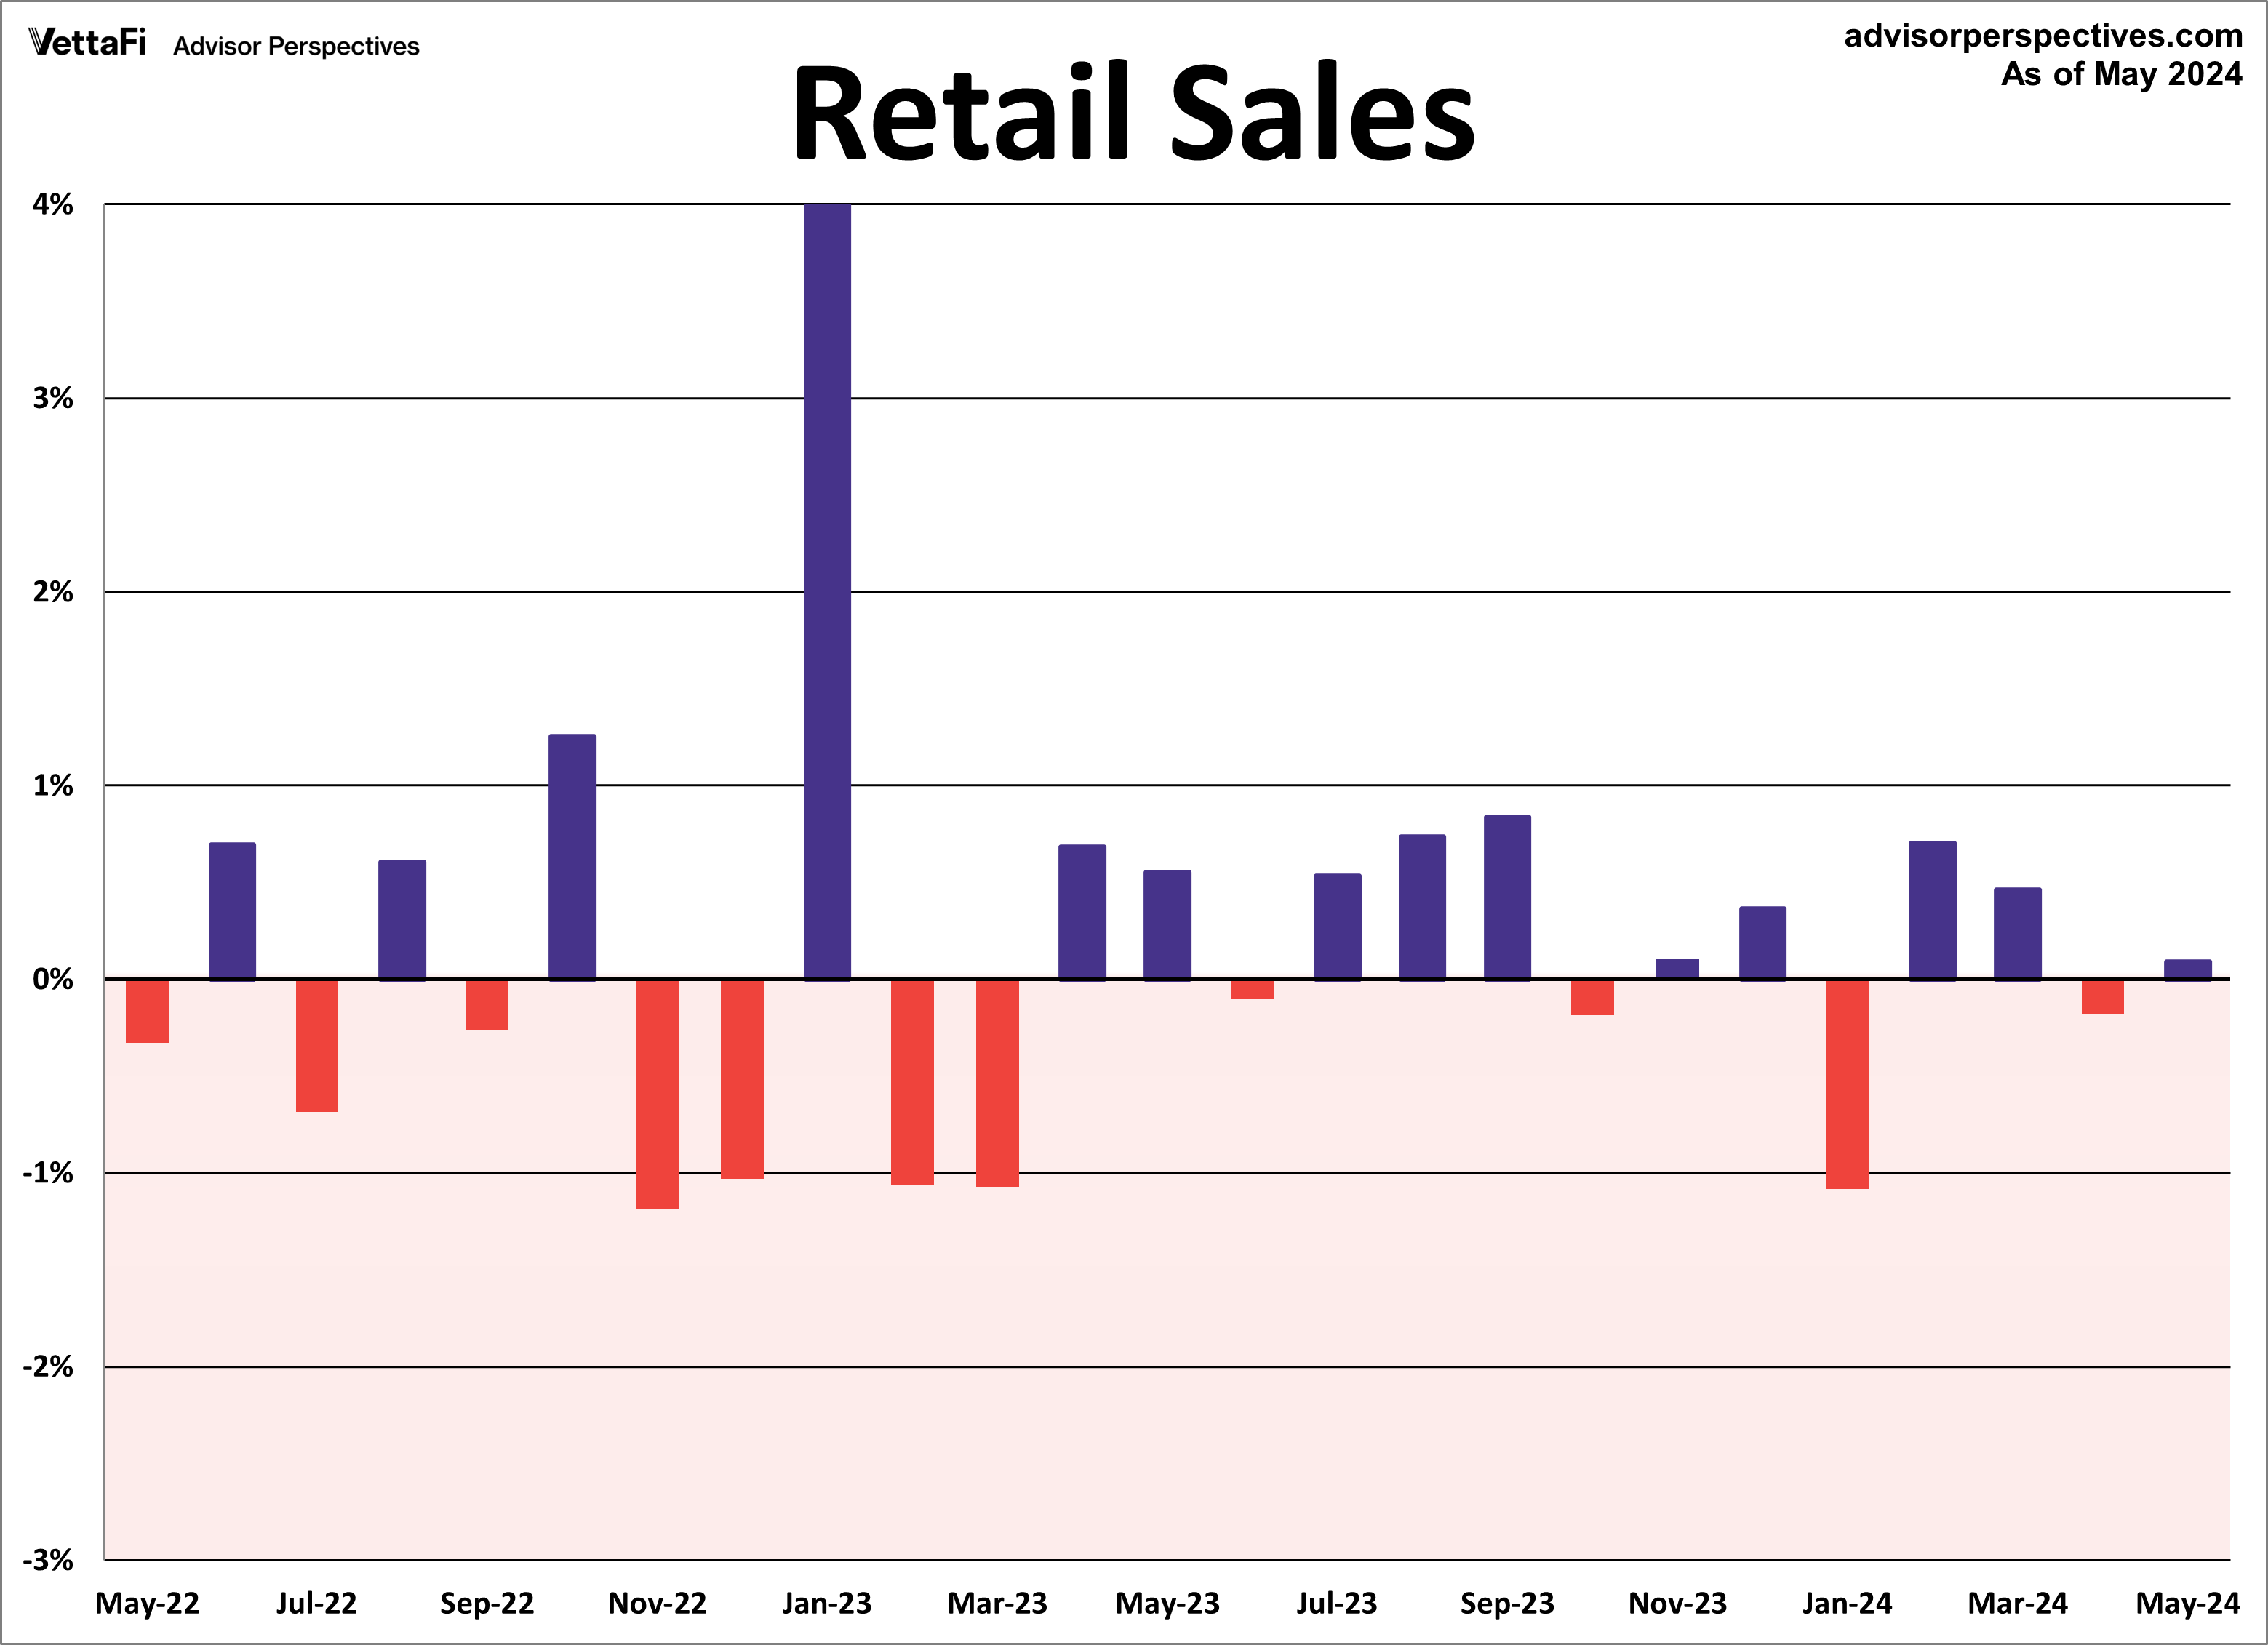
The Census Bureau’s Advance Retail Sales Report for May revealed headline sales rose 0.1% in May. The latest reading was below the expected 0.3% monthly rise in consumer spending.
For an inflation-adjusted perspective on retail sales, take a look at our Real Retail Sales commentary.
Here is the introduction from today’s report:
Advance estimates of U.S. retail and food services sales for May 2024, adjusted for seasonal variation and holiday and trading-day differences, but not for price changes, were $703.1 billion, up 0.1 percent (±0.4 percent)* from the previous month, and up 2.3 percent (±0.5 percent) above May 2023. Total sales for the March 2024 through May 2024 period were up 2.9 percent (±0.5 percent) from the same period a year ago. The March 2024 to April 2024 percent change was revised from virtually unchanged (±0.4 percent)* to down 0.2 percent (±0.2 percent)*.
Retail trade sales were up 0.2 percent (±0.4 percent)* from April 2024, and up 2.0 percent (±0.5 percent) above last year. Nonstore retailers were up 6.8 percent (±1.4 percent) from last year, while food services and drinking places were up 3.8 percent (±2.3 percent) from May 2023.
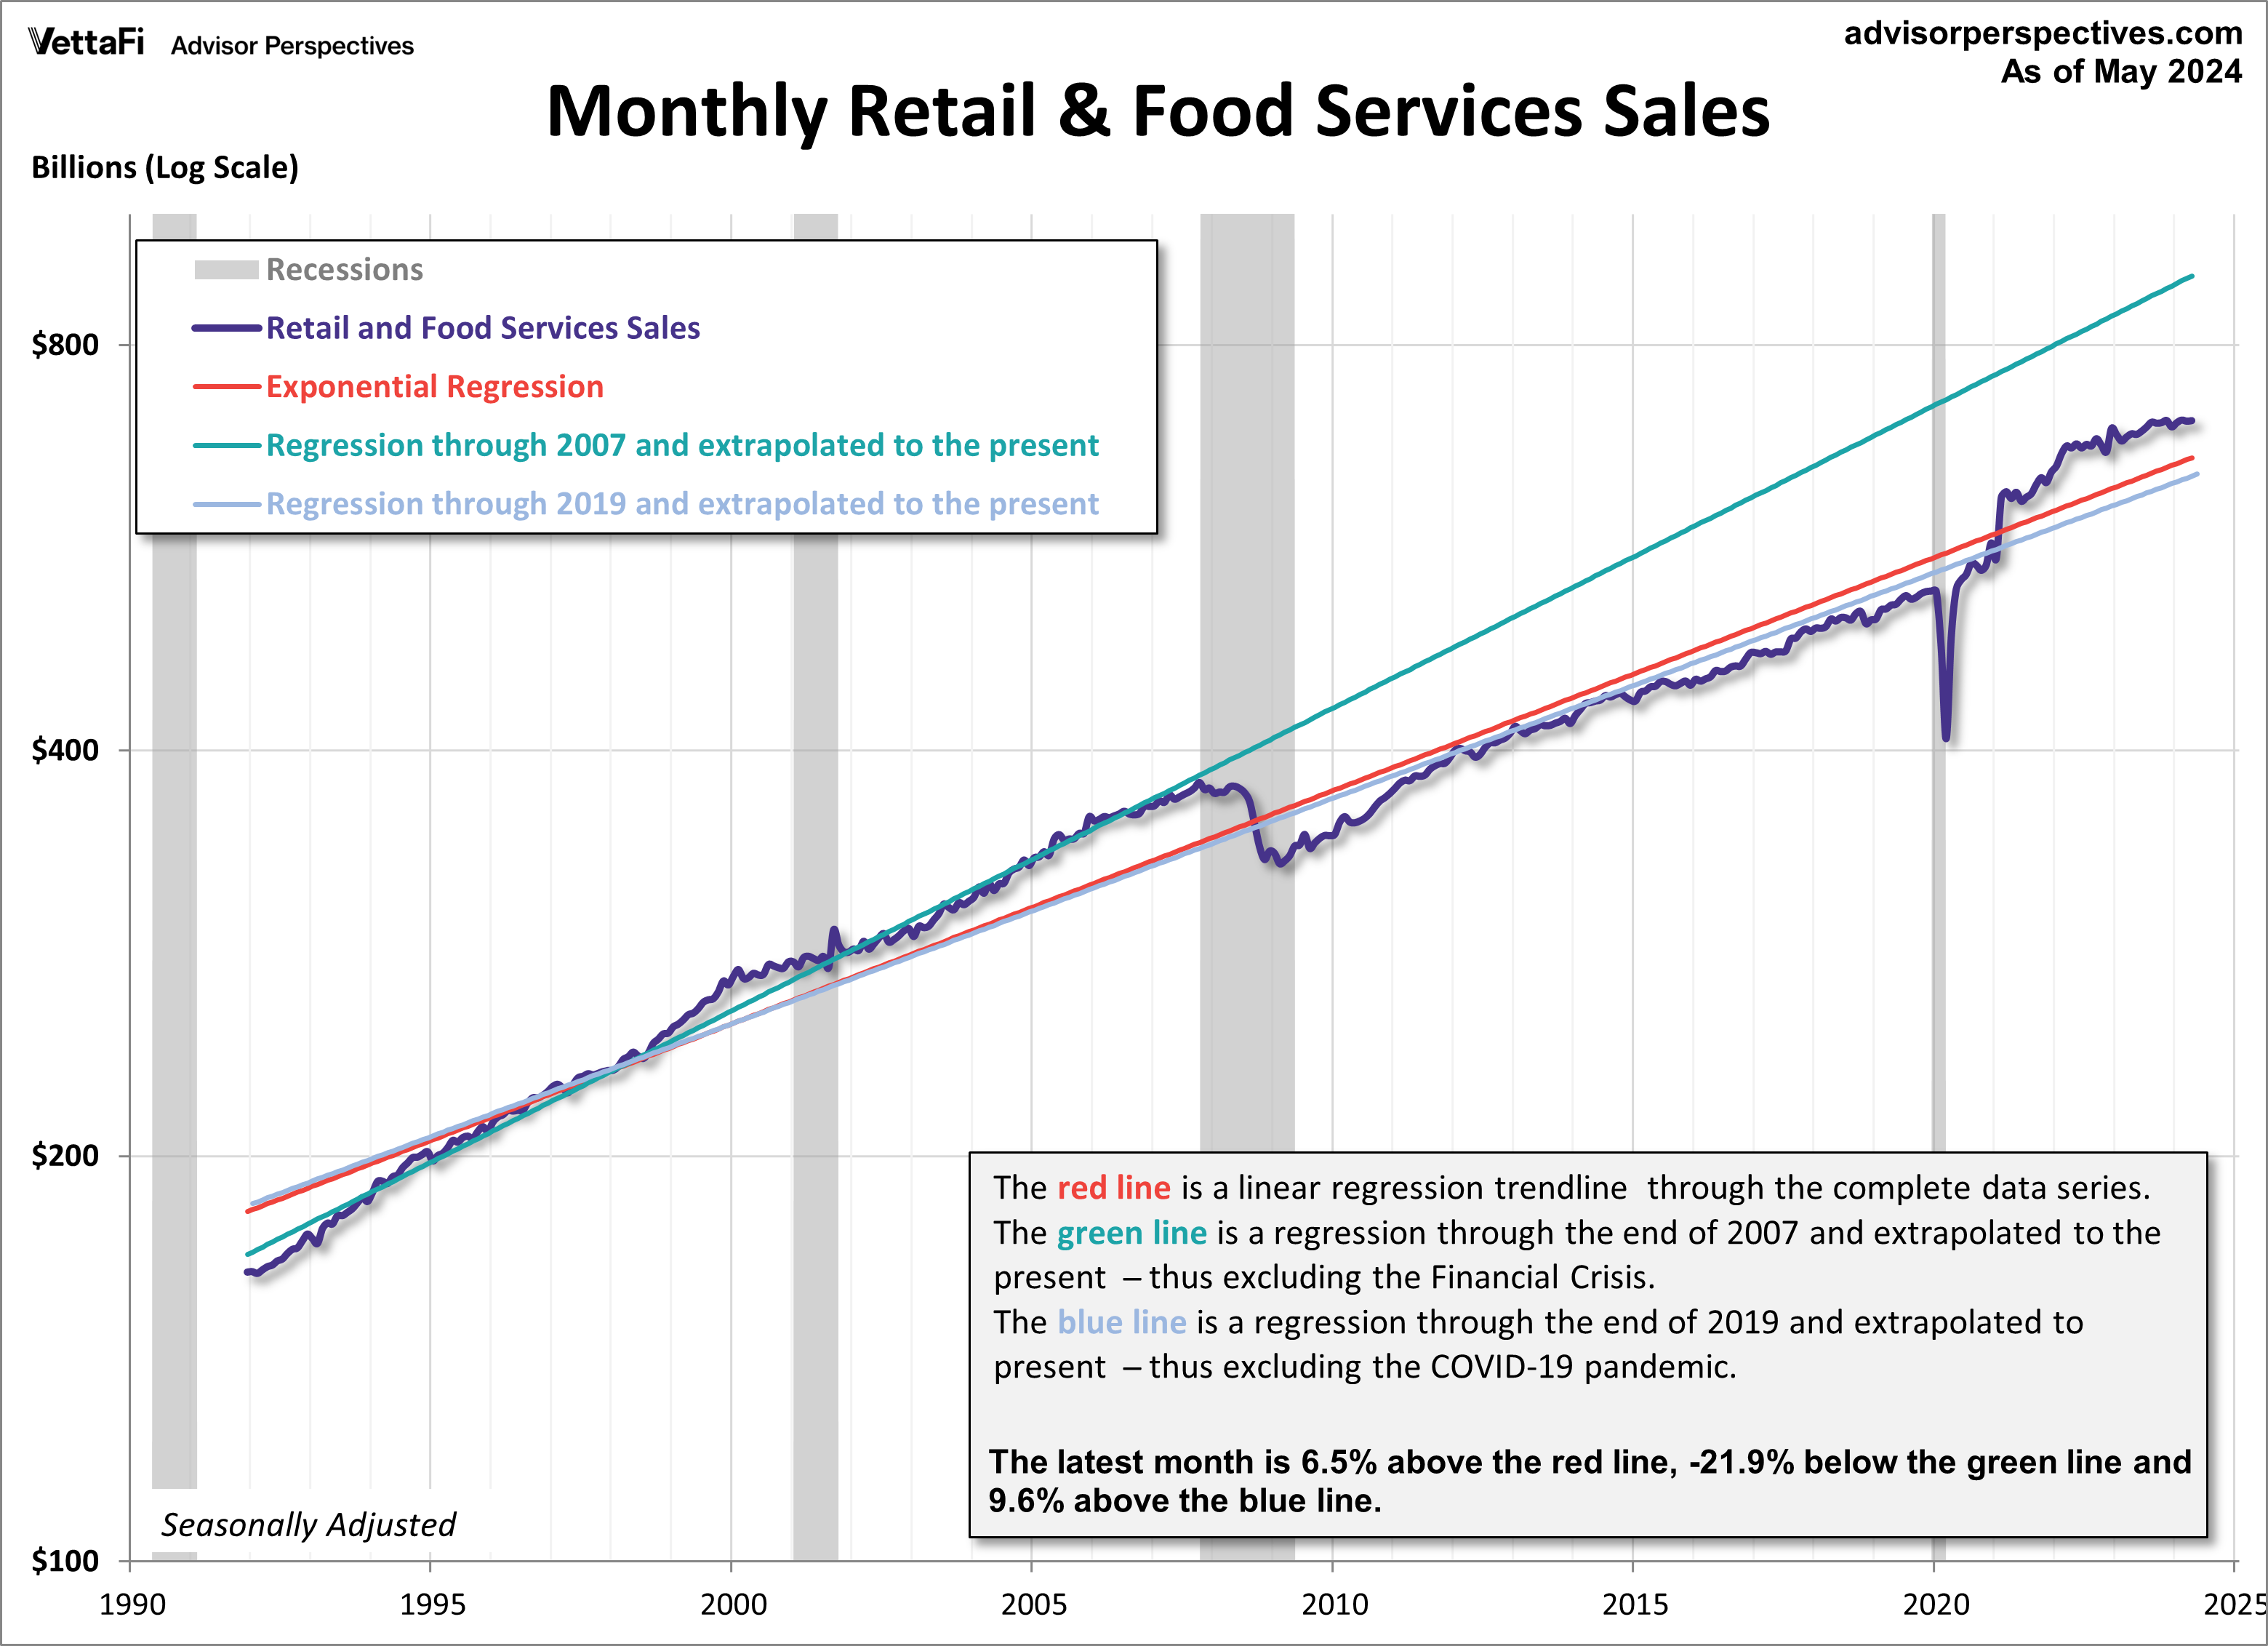
The chart below is a log-scale snapshot of retail sales since the early 1990s. The three exponential regressions through the data help us to evaluate the long-term trend of this key economic indicator.
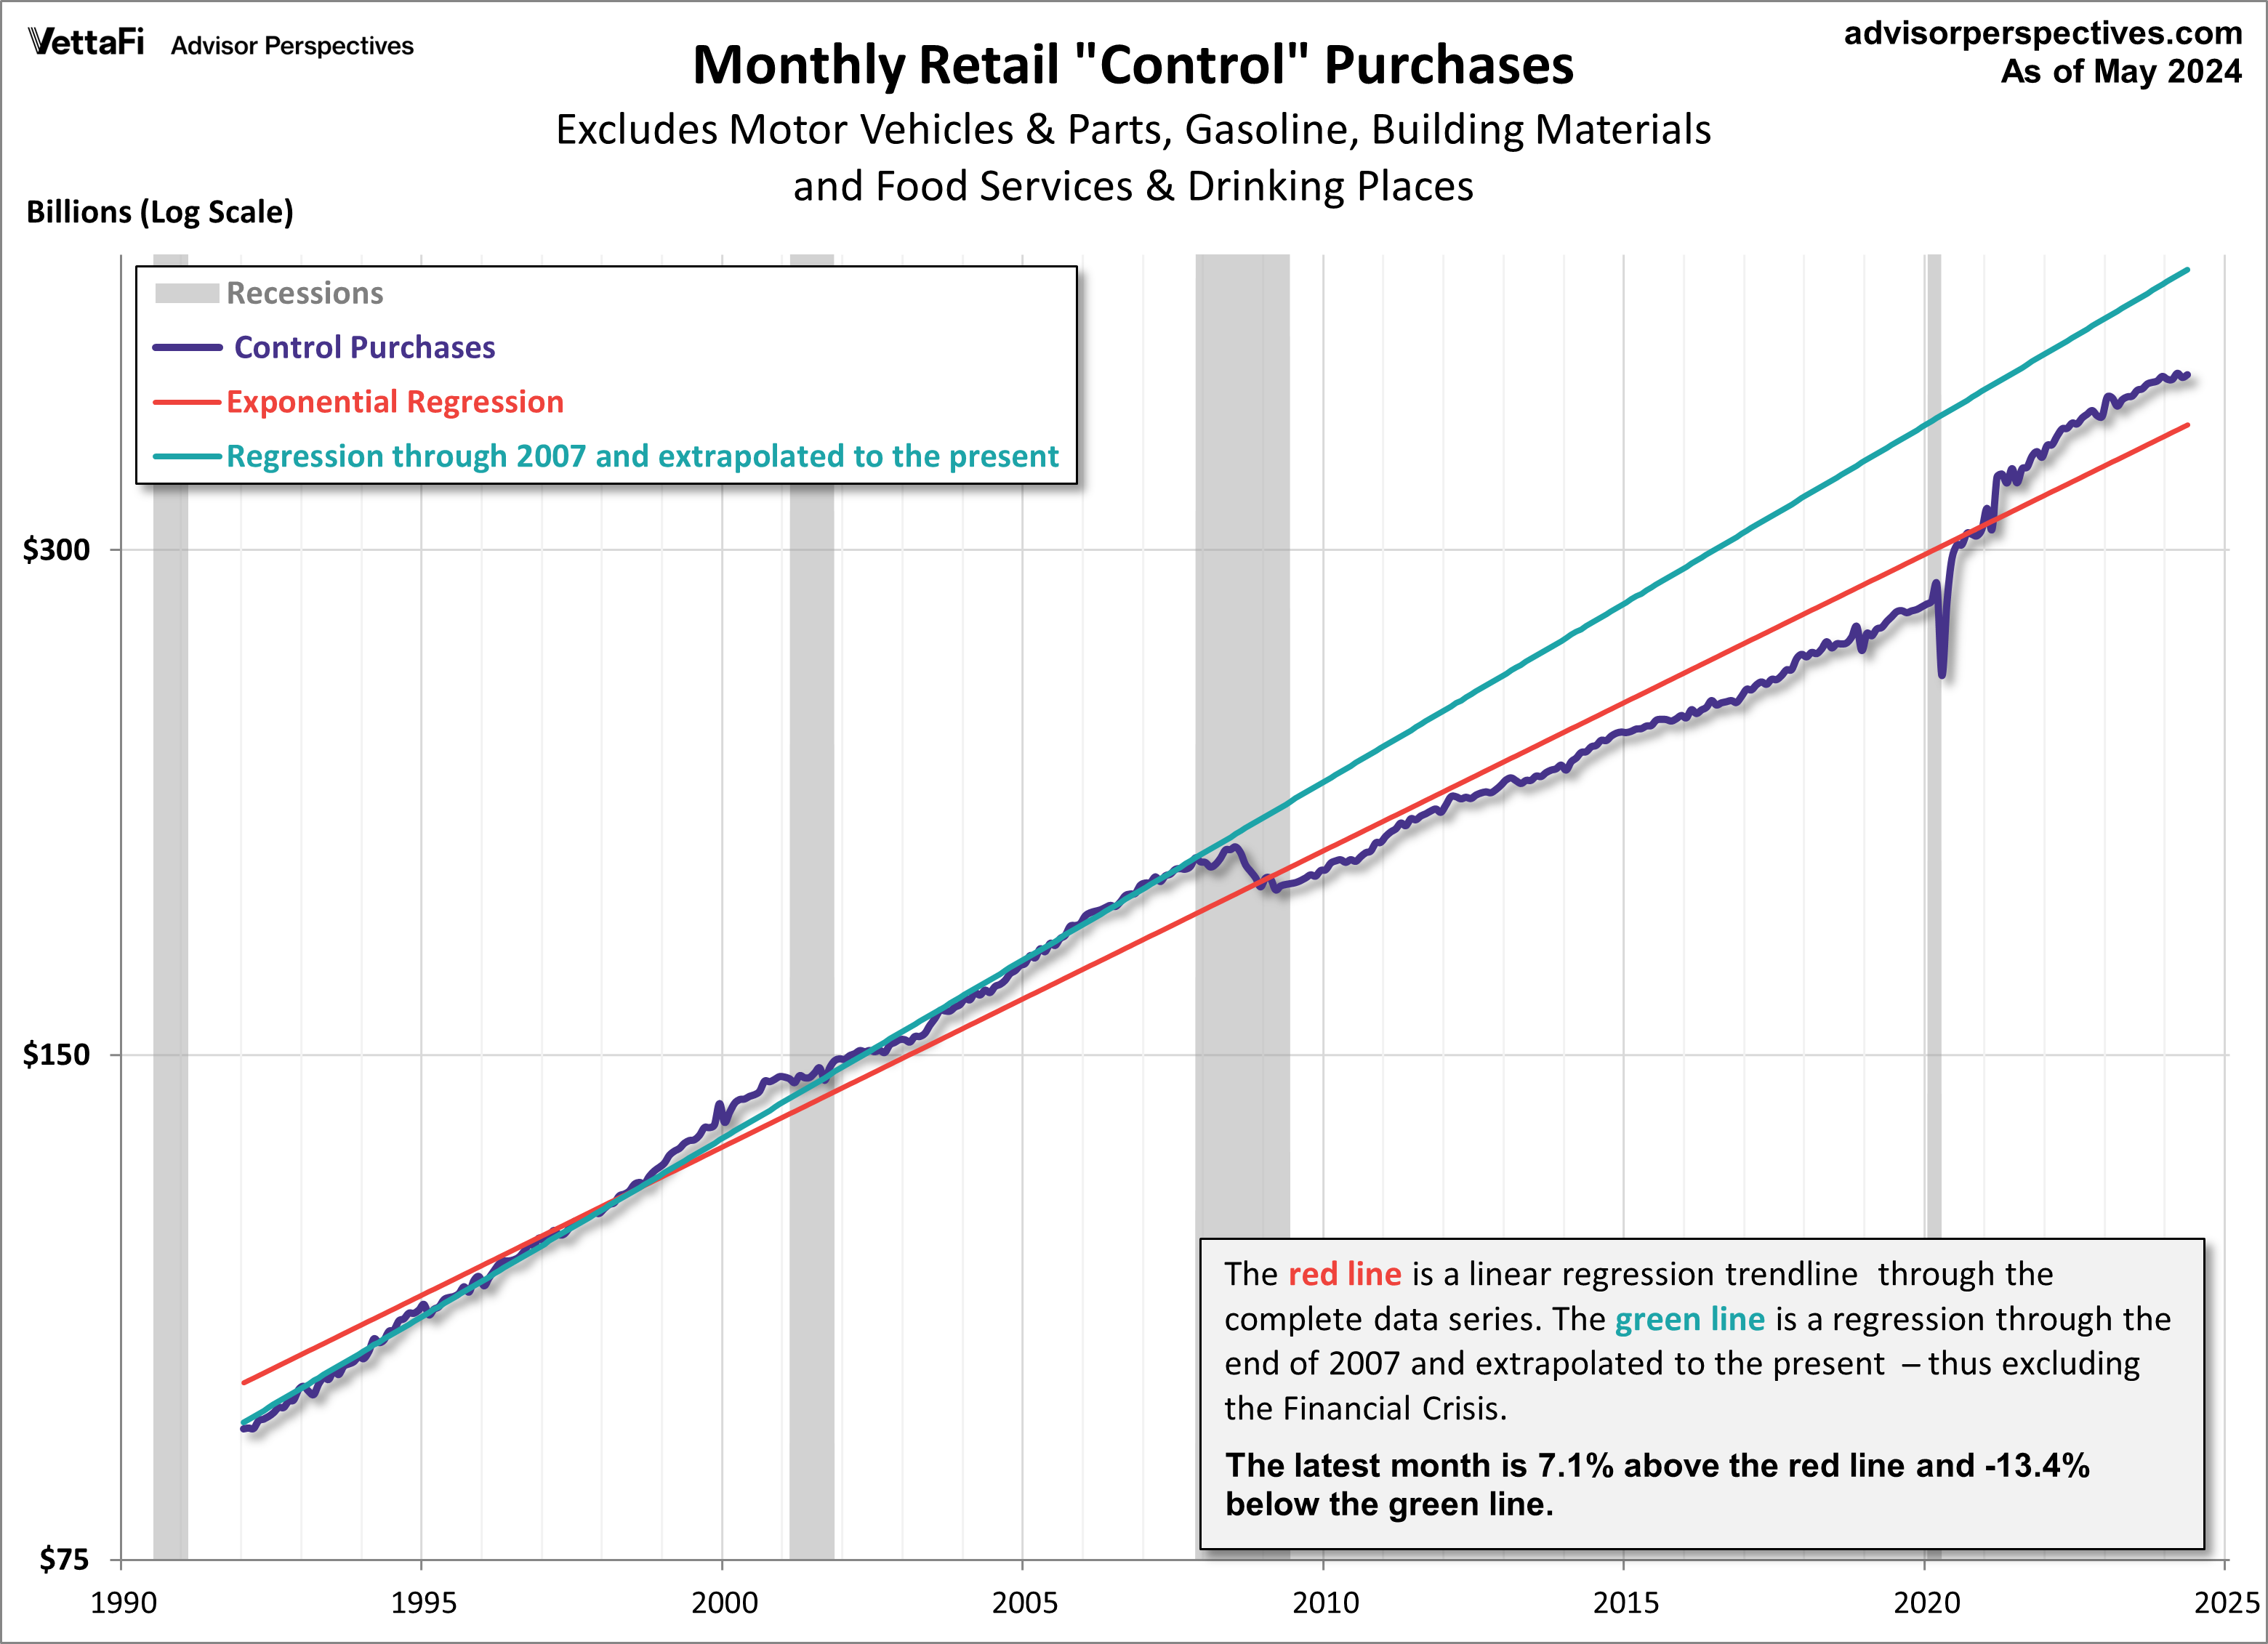
- The red line is a linear regression through the complete data series.
- The green line is a regression from the start of the series through the end of 2007. It is then extrapolated to the present – thus excluding the Financial Crisis.
- The blue line is a regression from the start of the series through the end of 2019. It is then extrapolated to the present – thus excluding the COVID-19 pandemic.
Monthly retail sales have been above the red and blue line since March 2021. This signals increased consumer spending that was most likely pent up as a result of the pandemic.
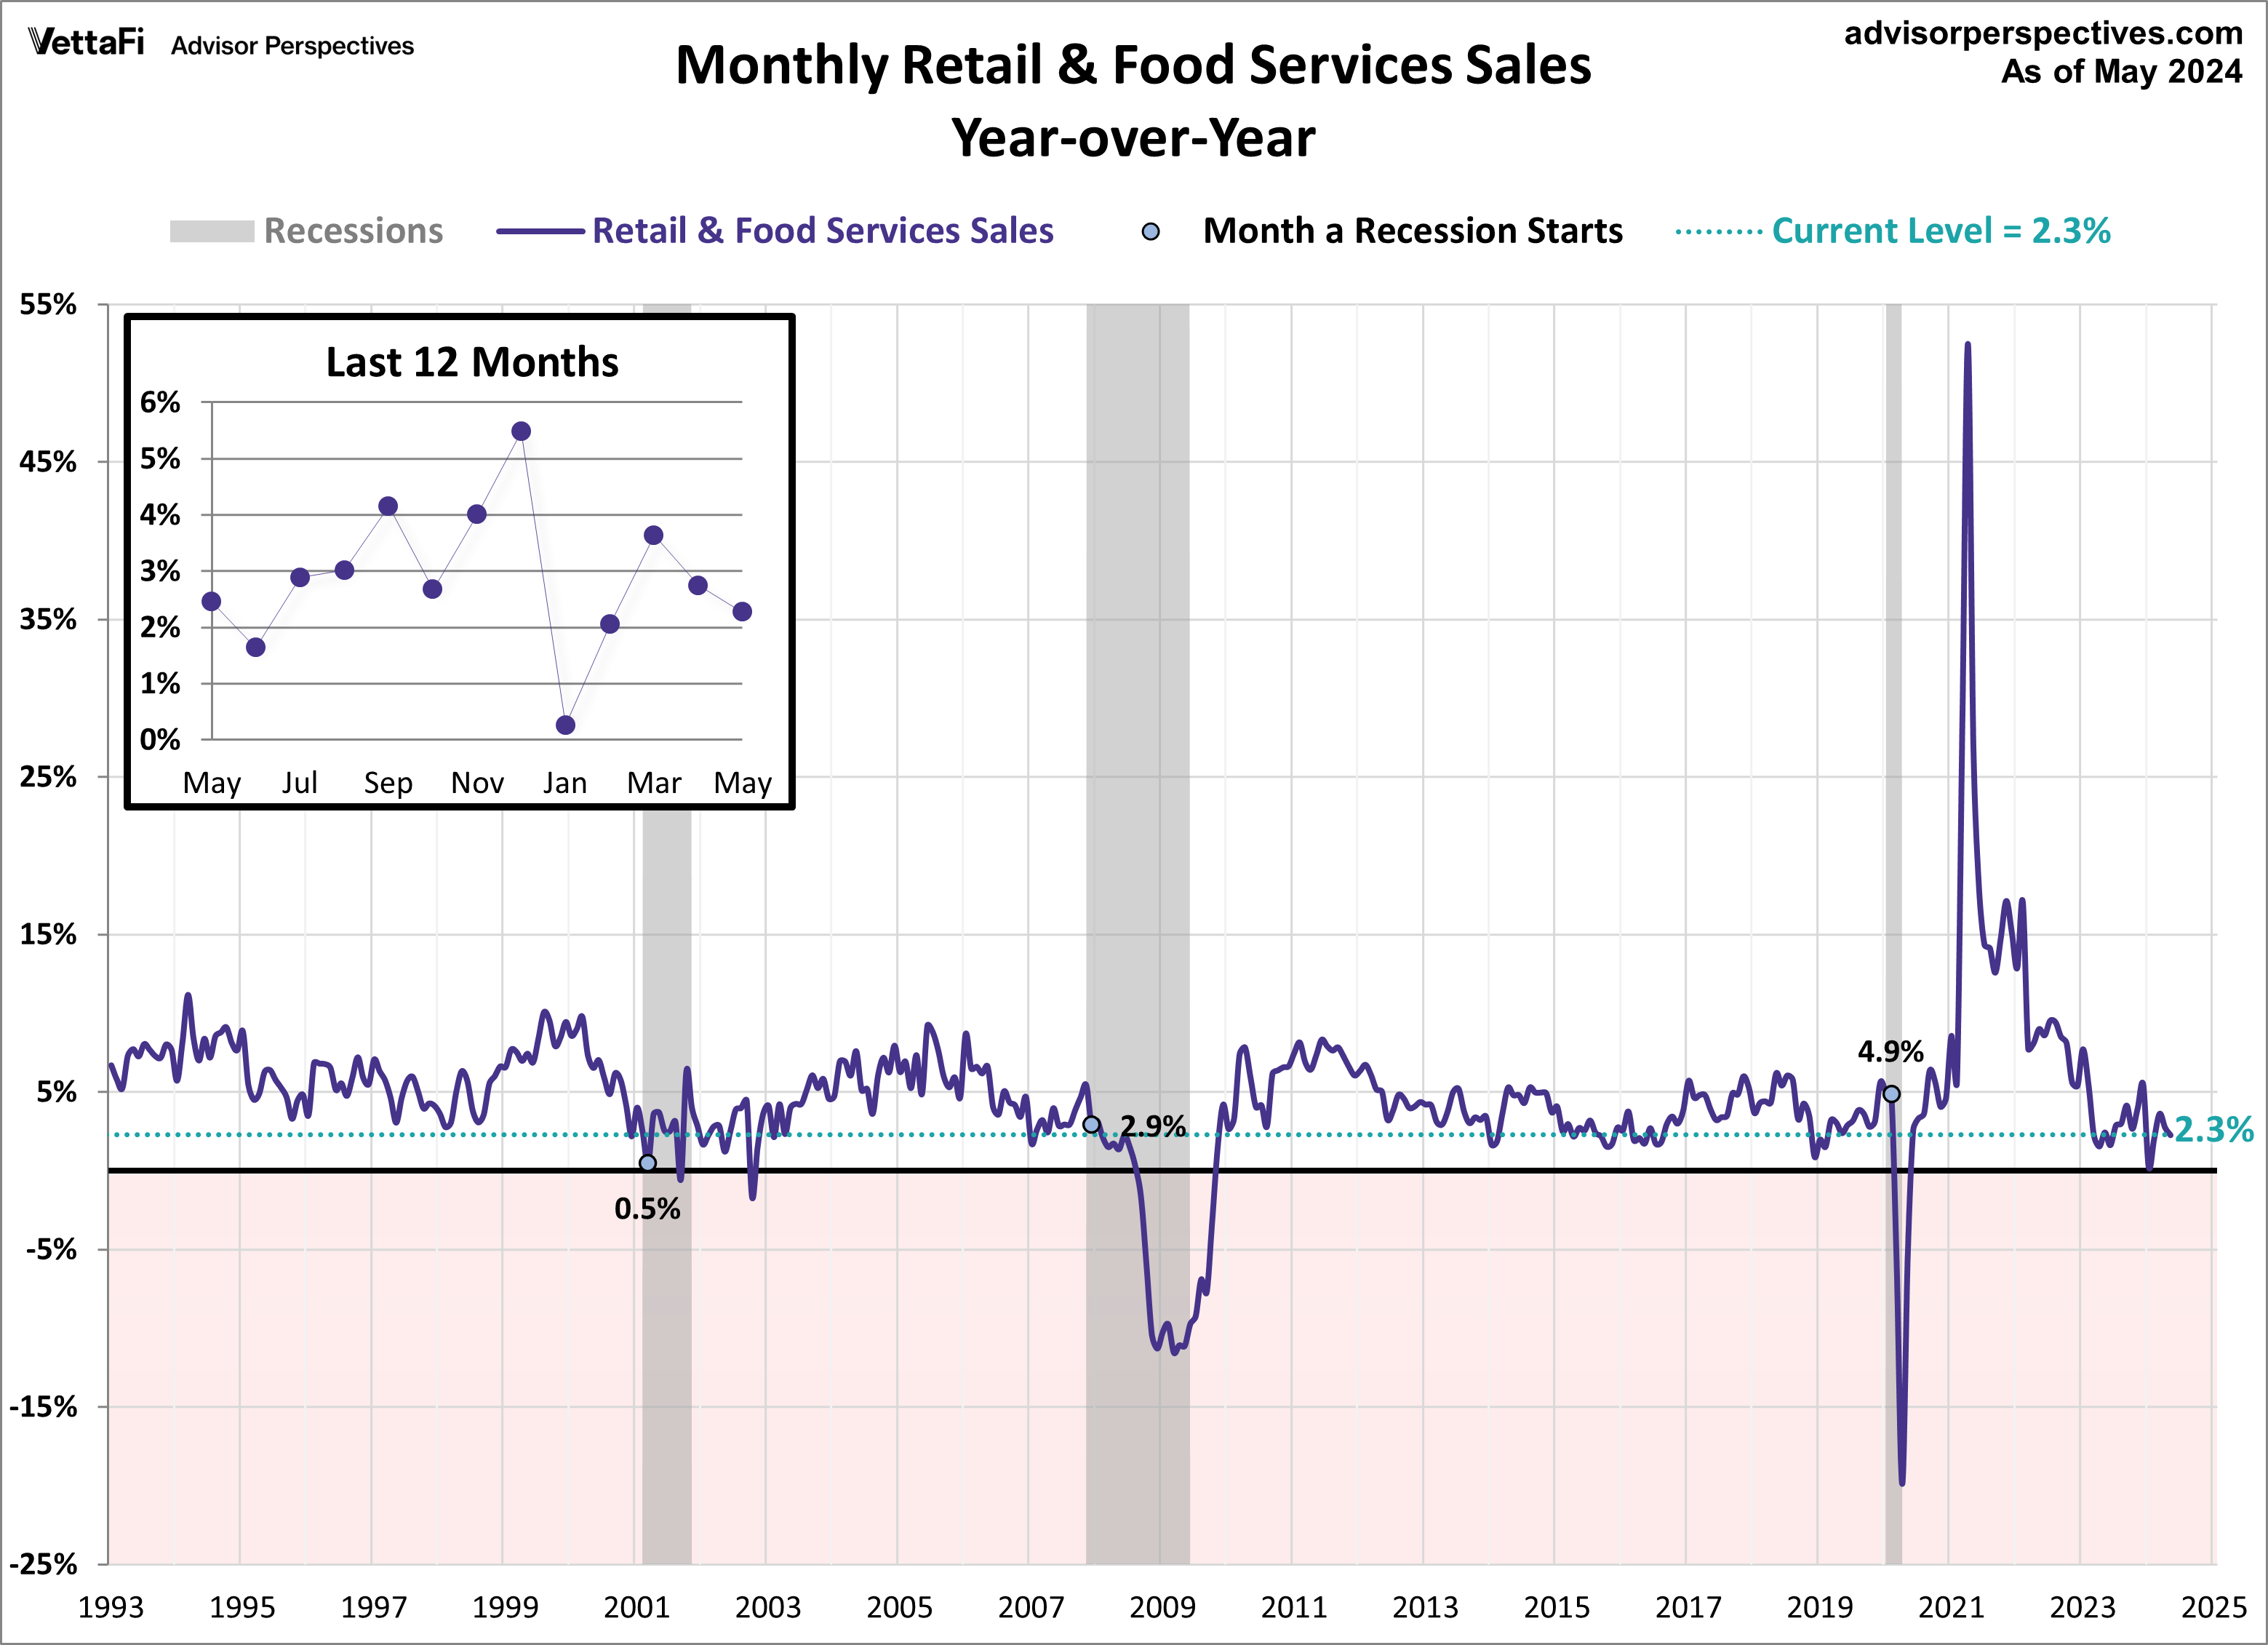
The year-over-year percent change provides another perspective on the historical trend. Current retail sales are up 2.3% compared to May 2023. Here is the headline series with a callout to the most recent 12 months.
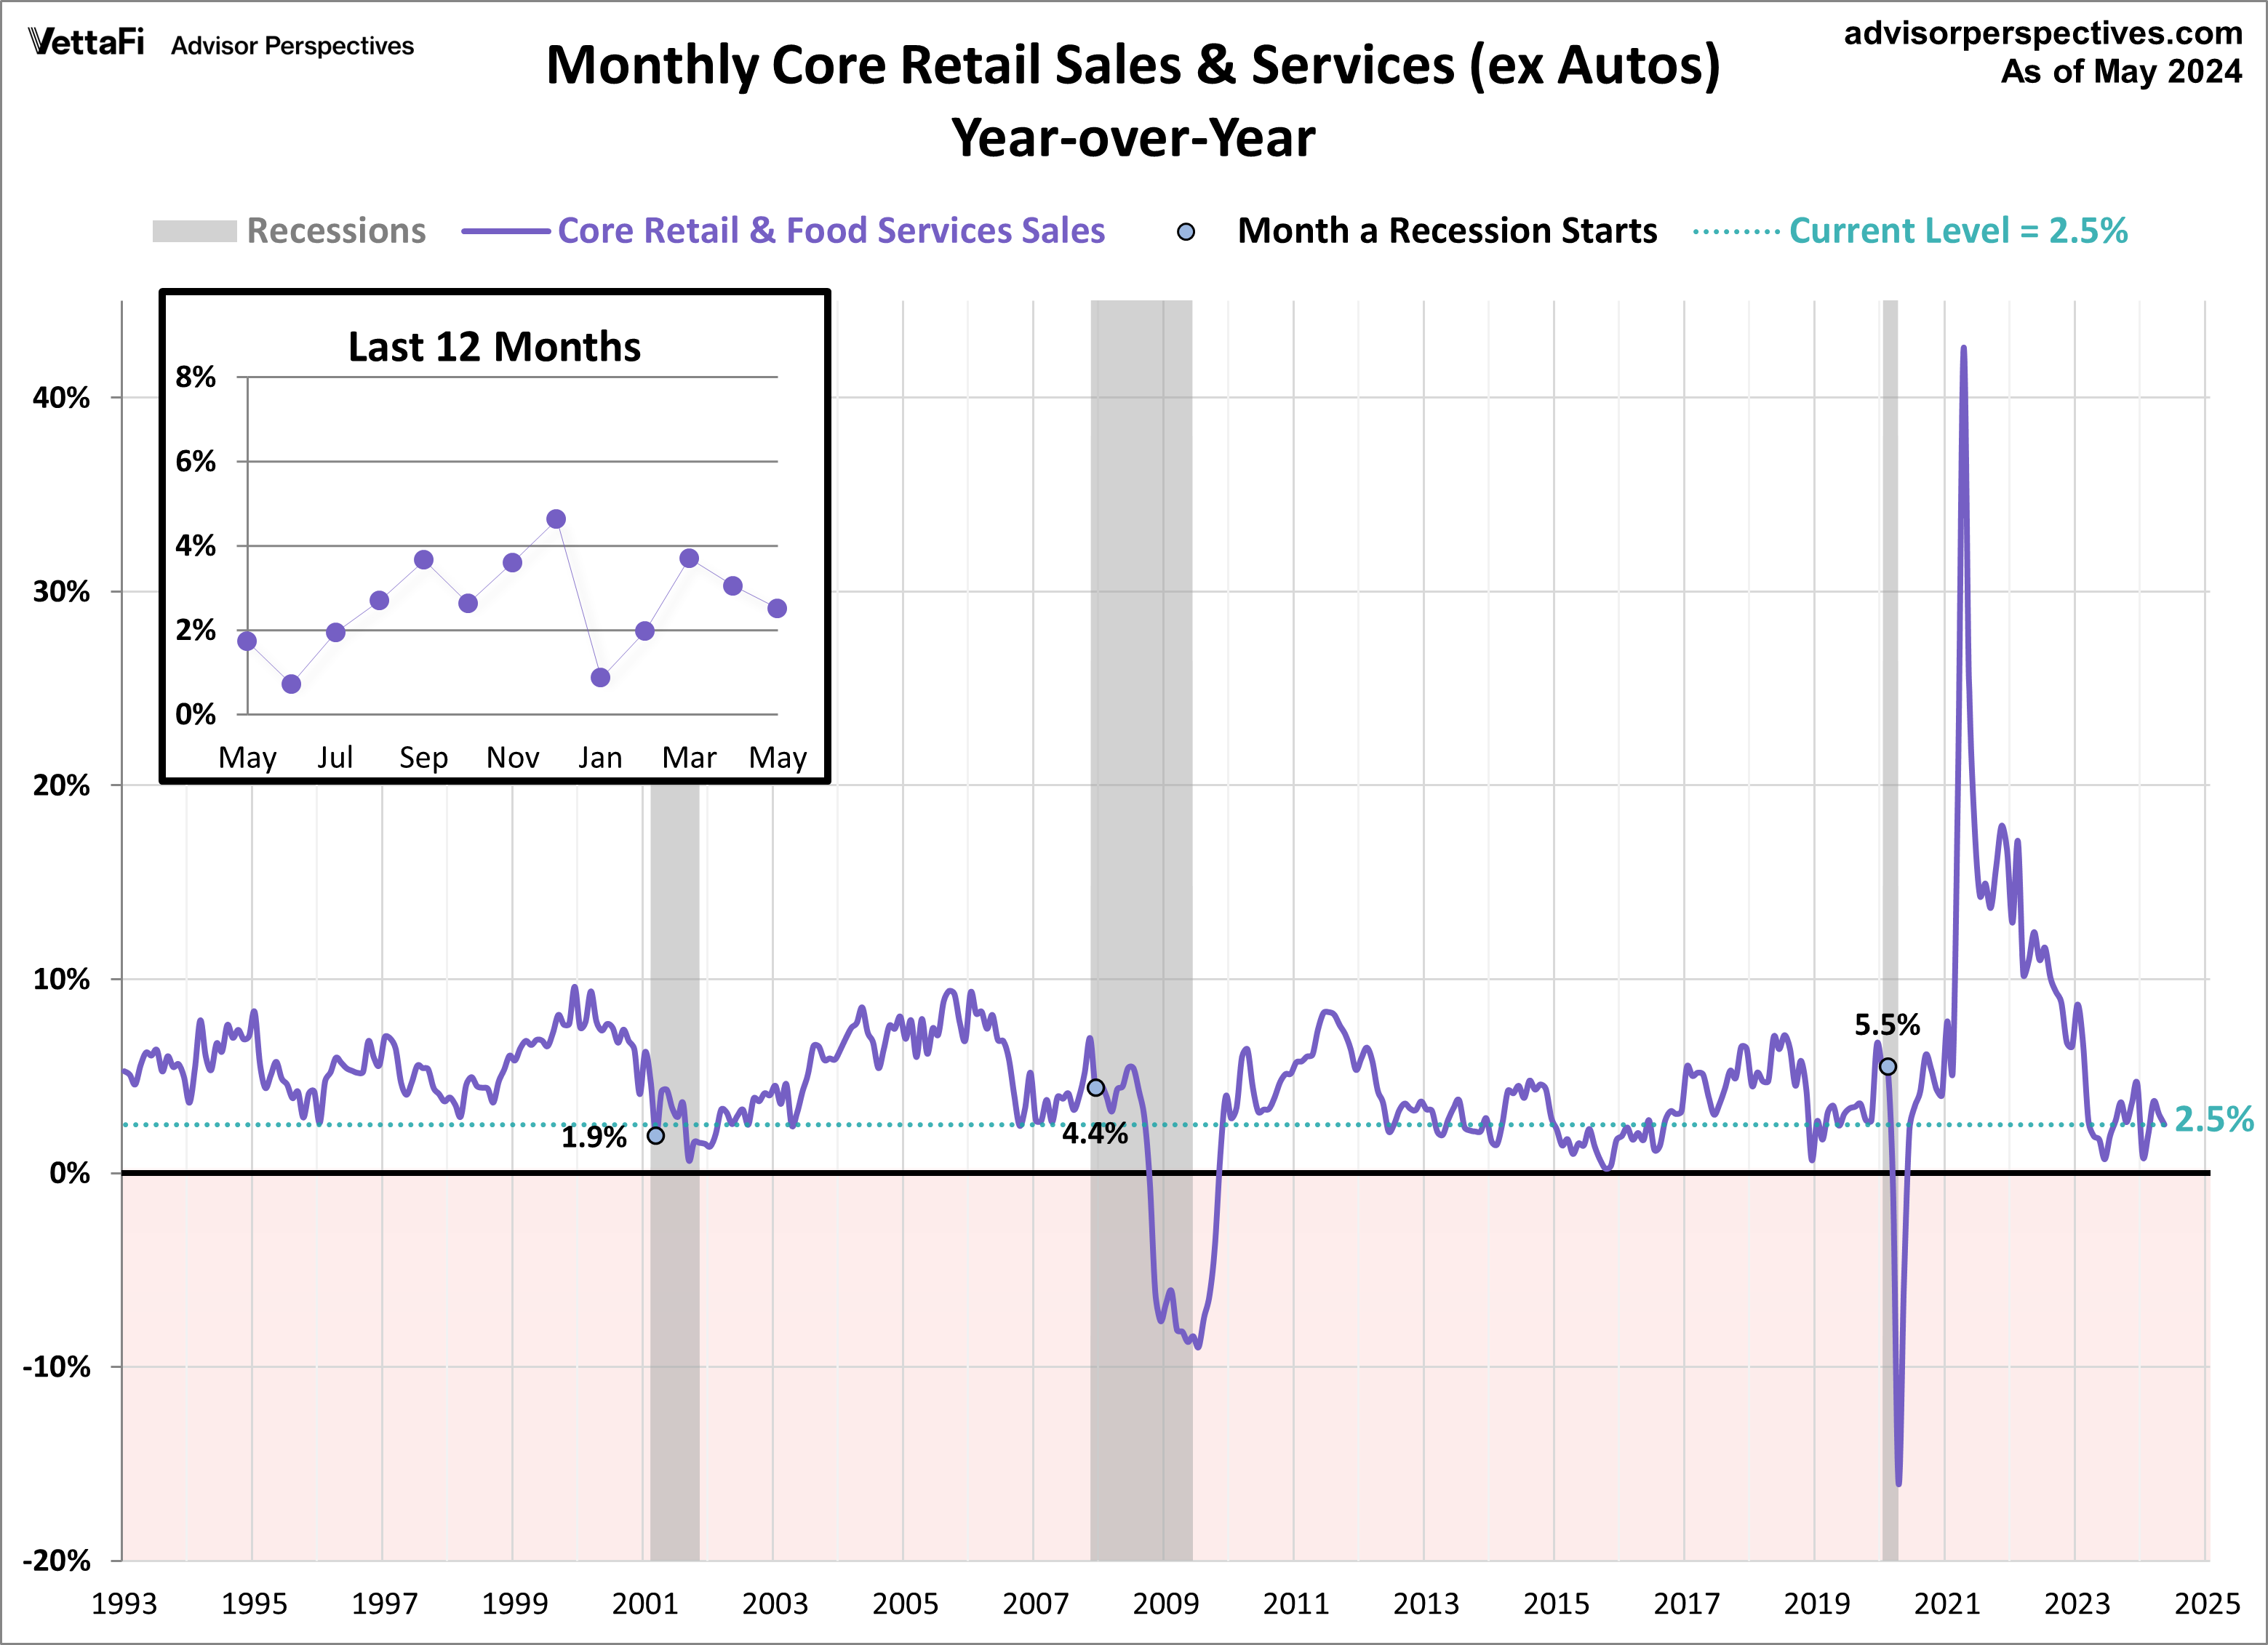
Core Retail Sales
Core sales (ex Autos) fell 0.1% in May, coming in below expectations of 0.2% growth.
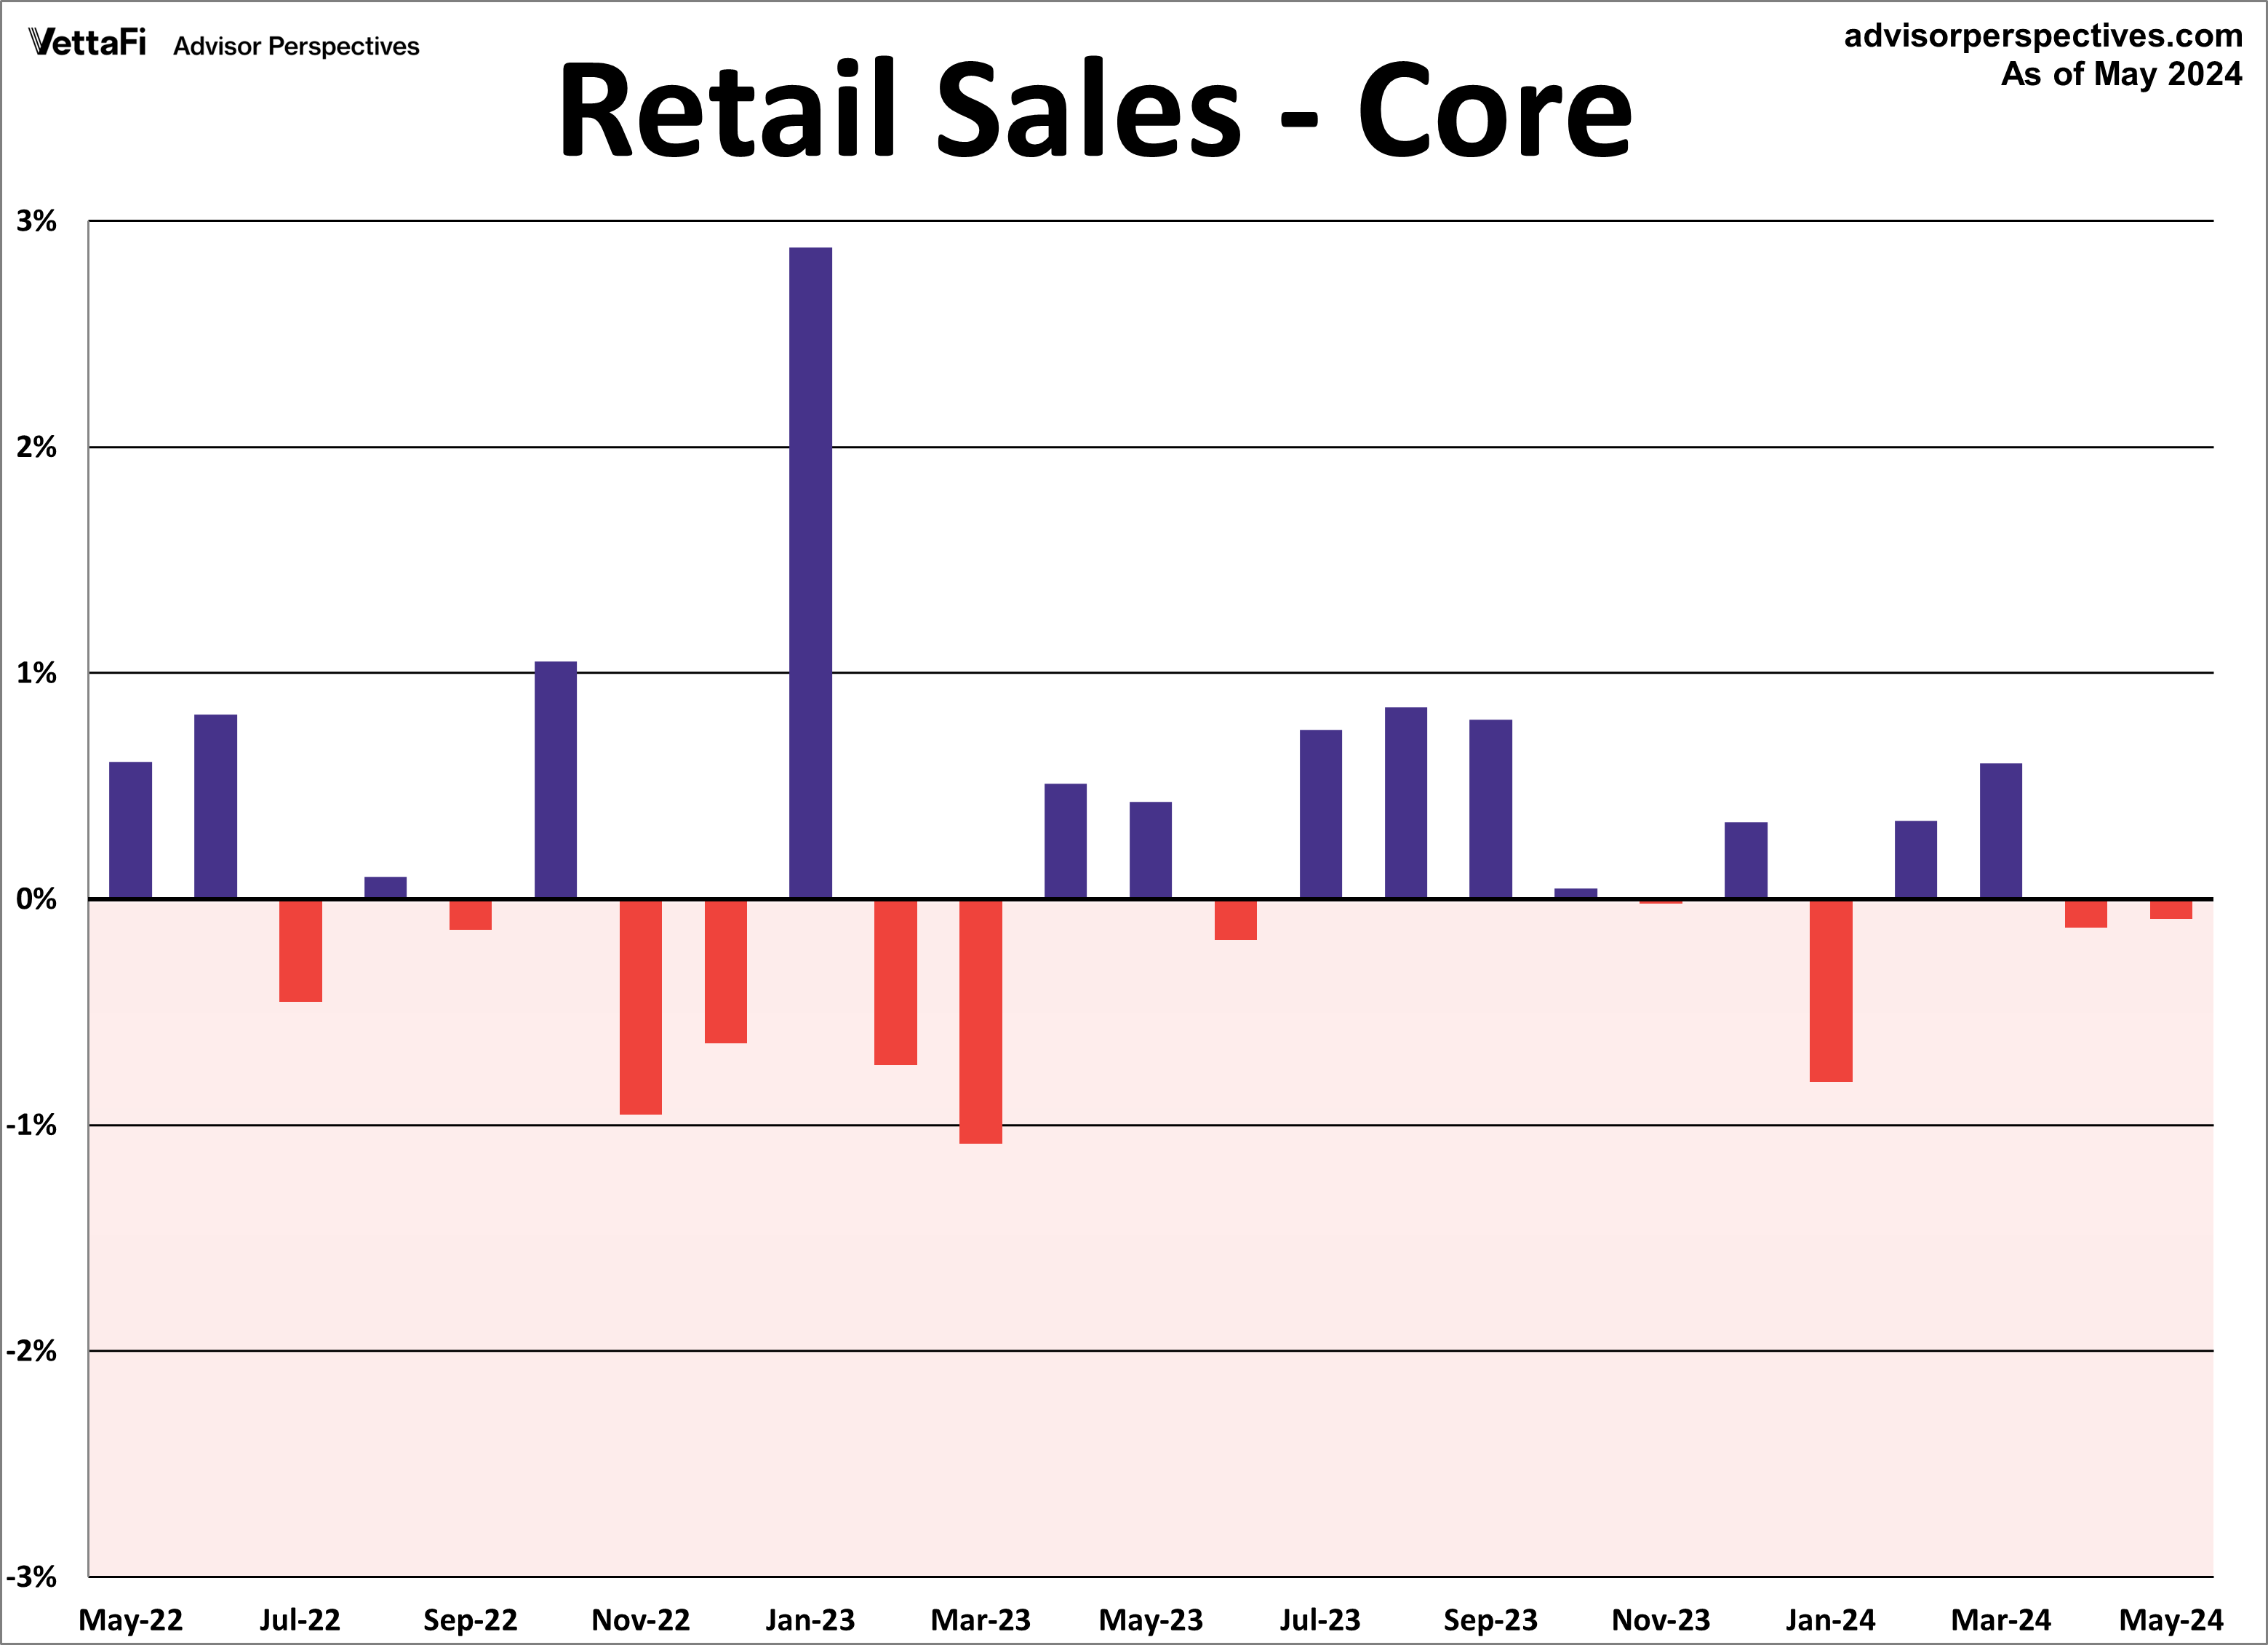
And core retail sales are up 2.5% compared to May 2023. Here is the year-over-year chart of core retail sales with a callout to the most recent 12 months.
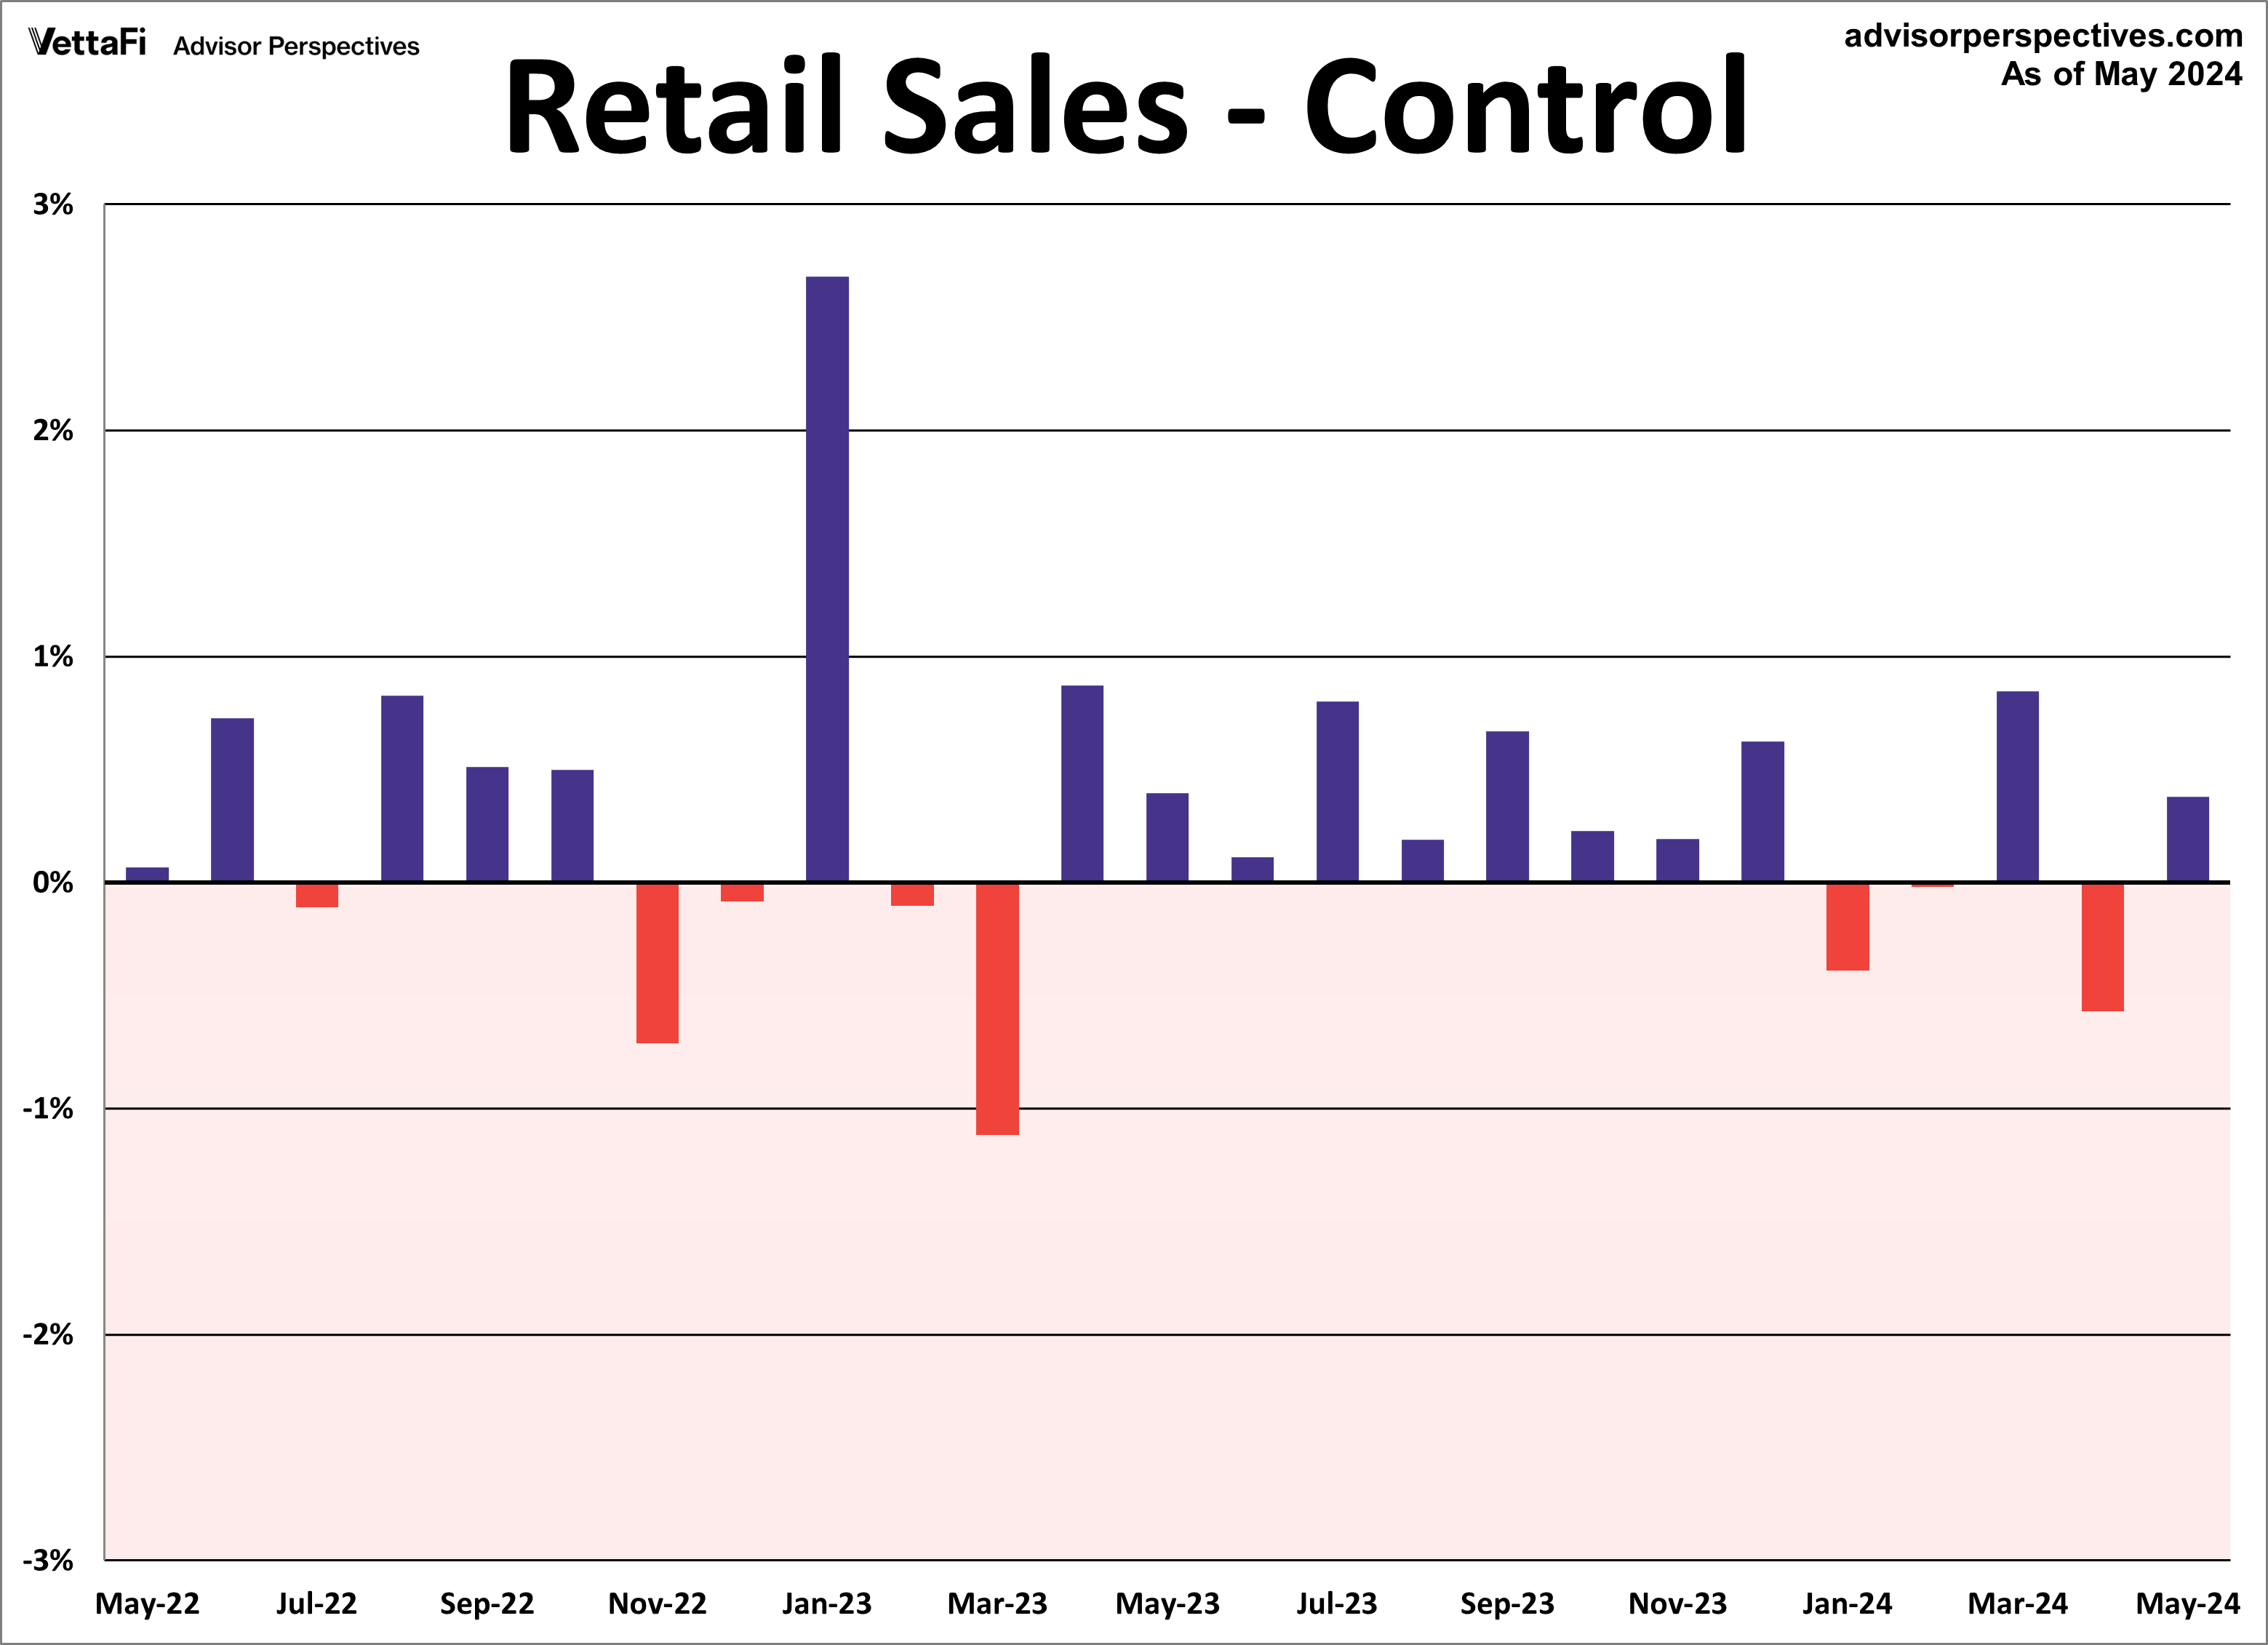
Retail Sales: ‘Control’ Purchases
The next two charts illustrate retail sales “control” purchases, which is an even more “core” view of retail sales. This series excludes motor vehicles & parts, gasoline, building materials as well as food services & drinking places. The popular financial press typically ignores this series, but it’s a more consistent and reliable reading of the economy. Retail sales control purchases were up 0.4% in May, in line with expectations.
Similar to the retail sales snapshot chart earlier, the chart below is a log-scale snapshot of control purchases since the early 1990s. It includes two of the exponential regressions previously mentioned.
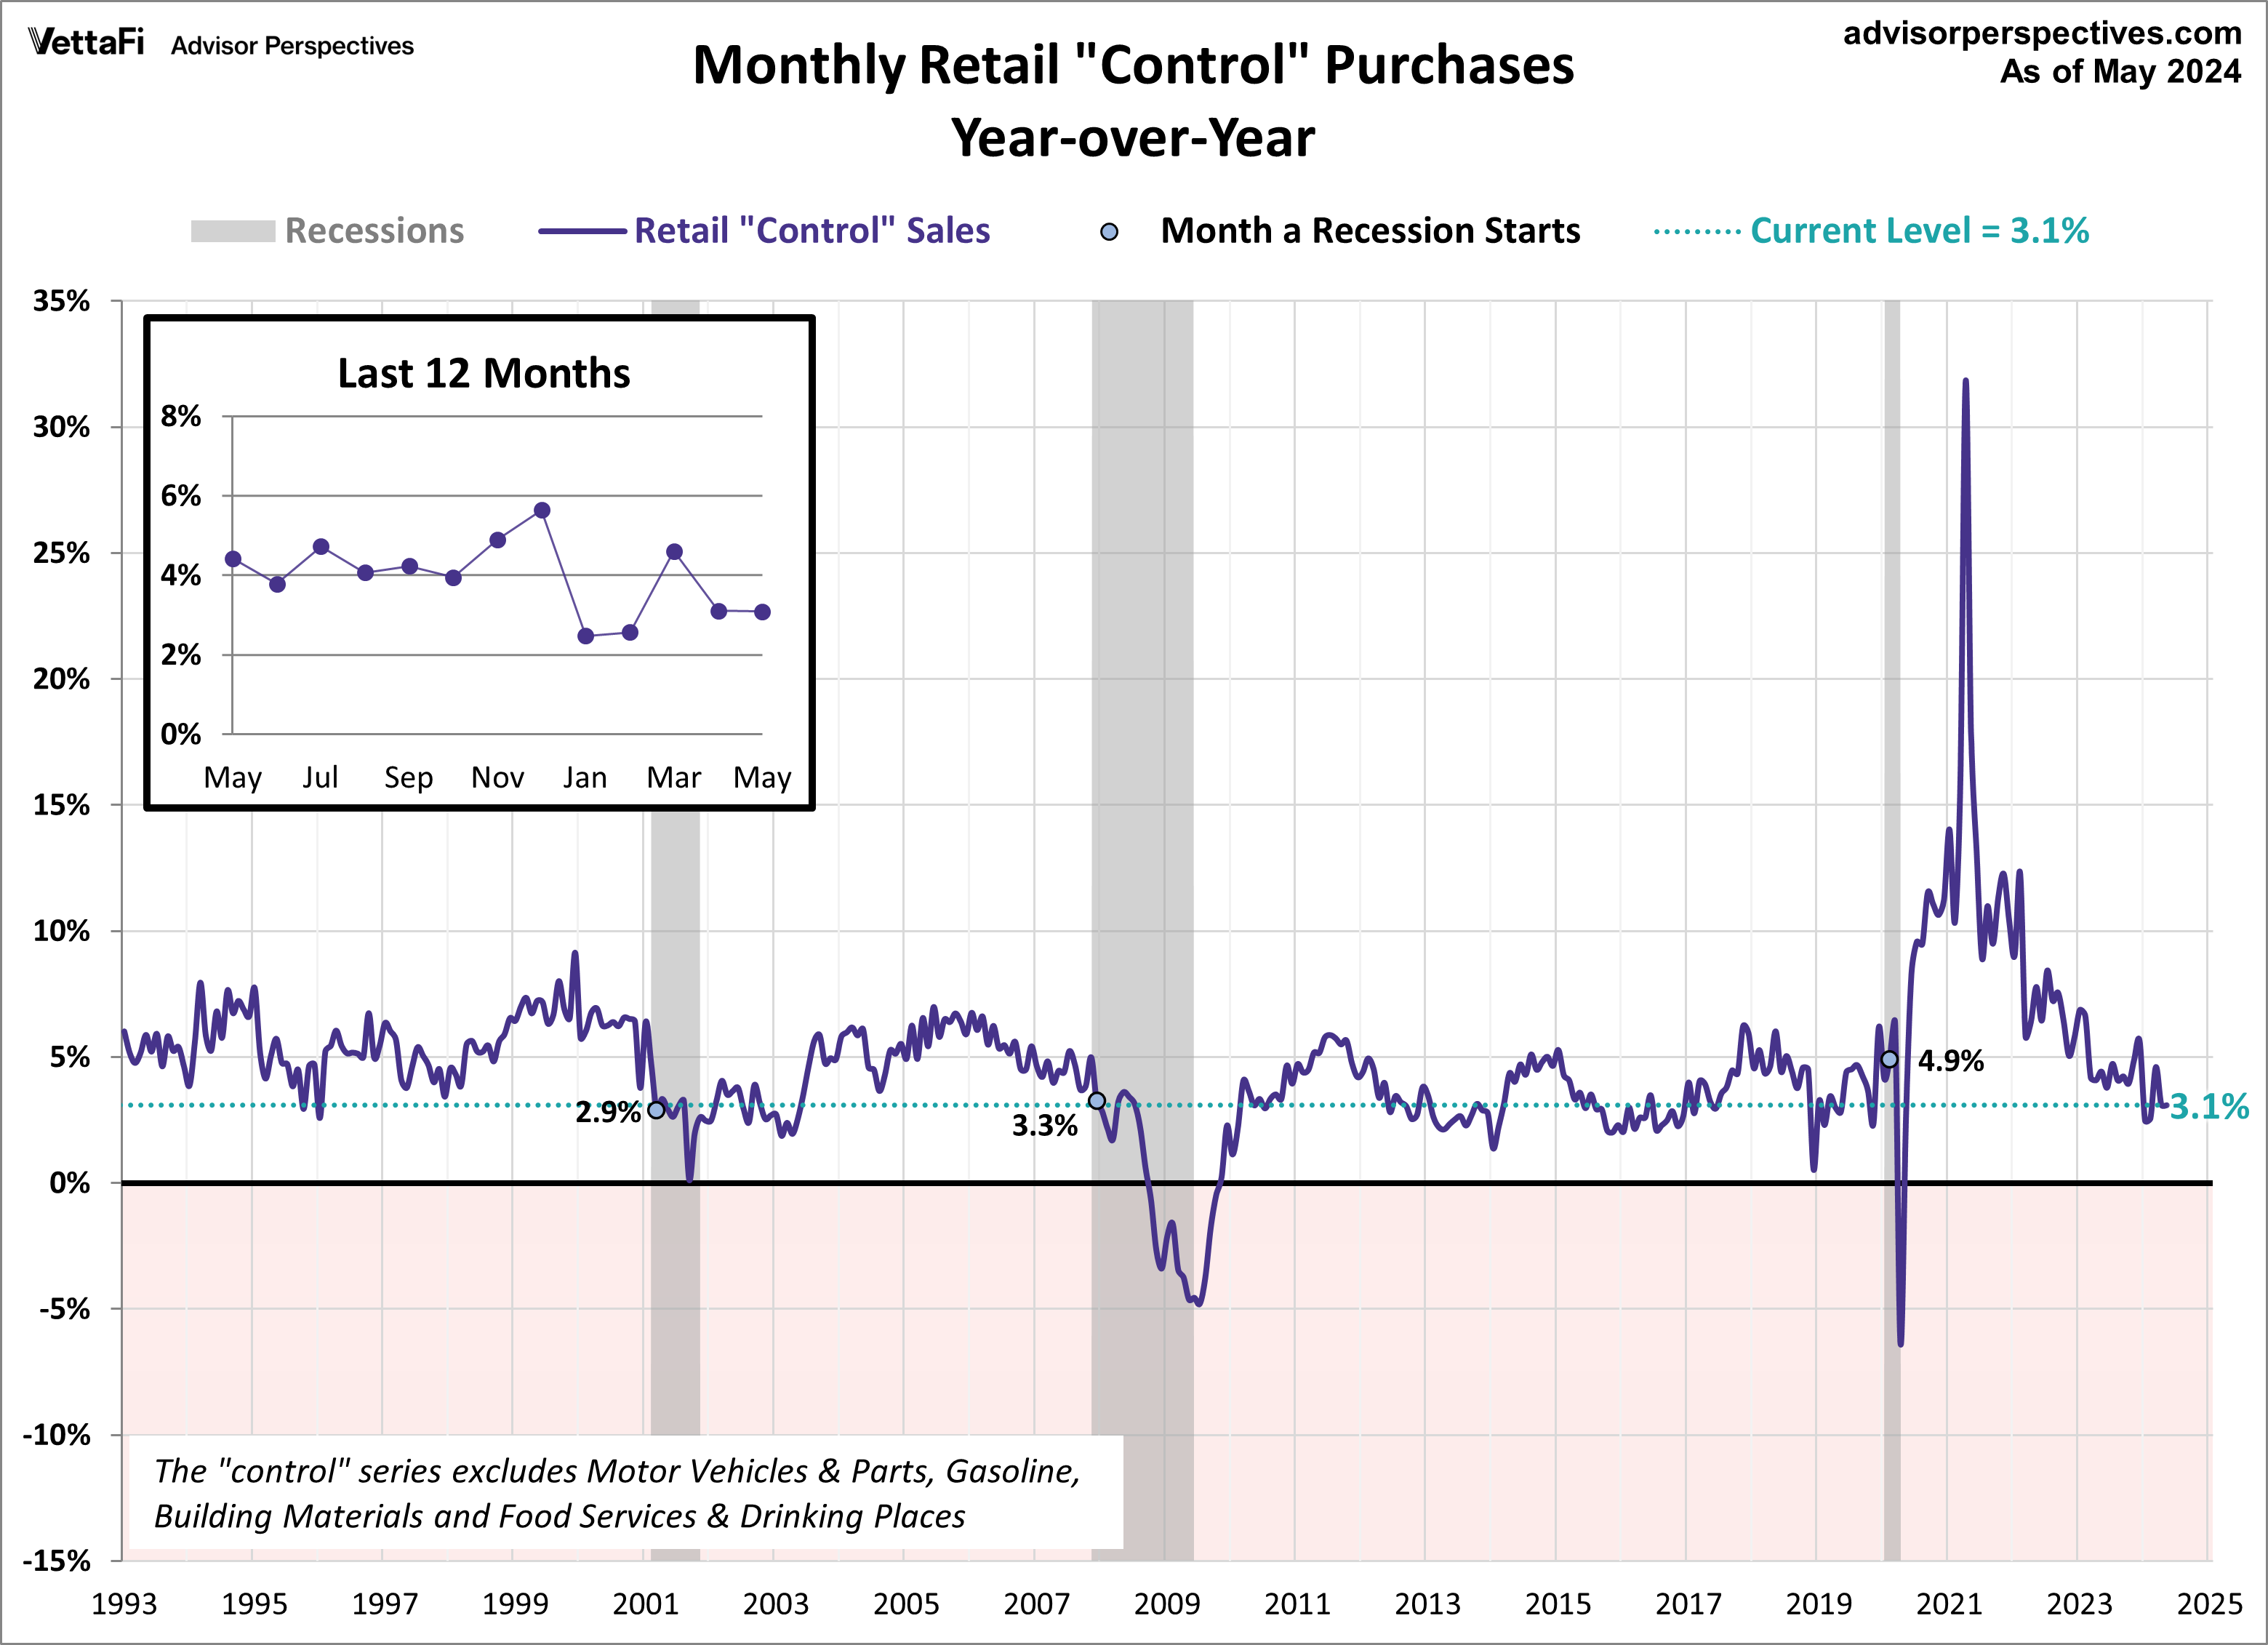
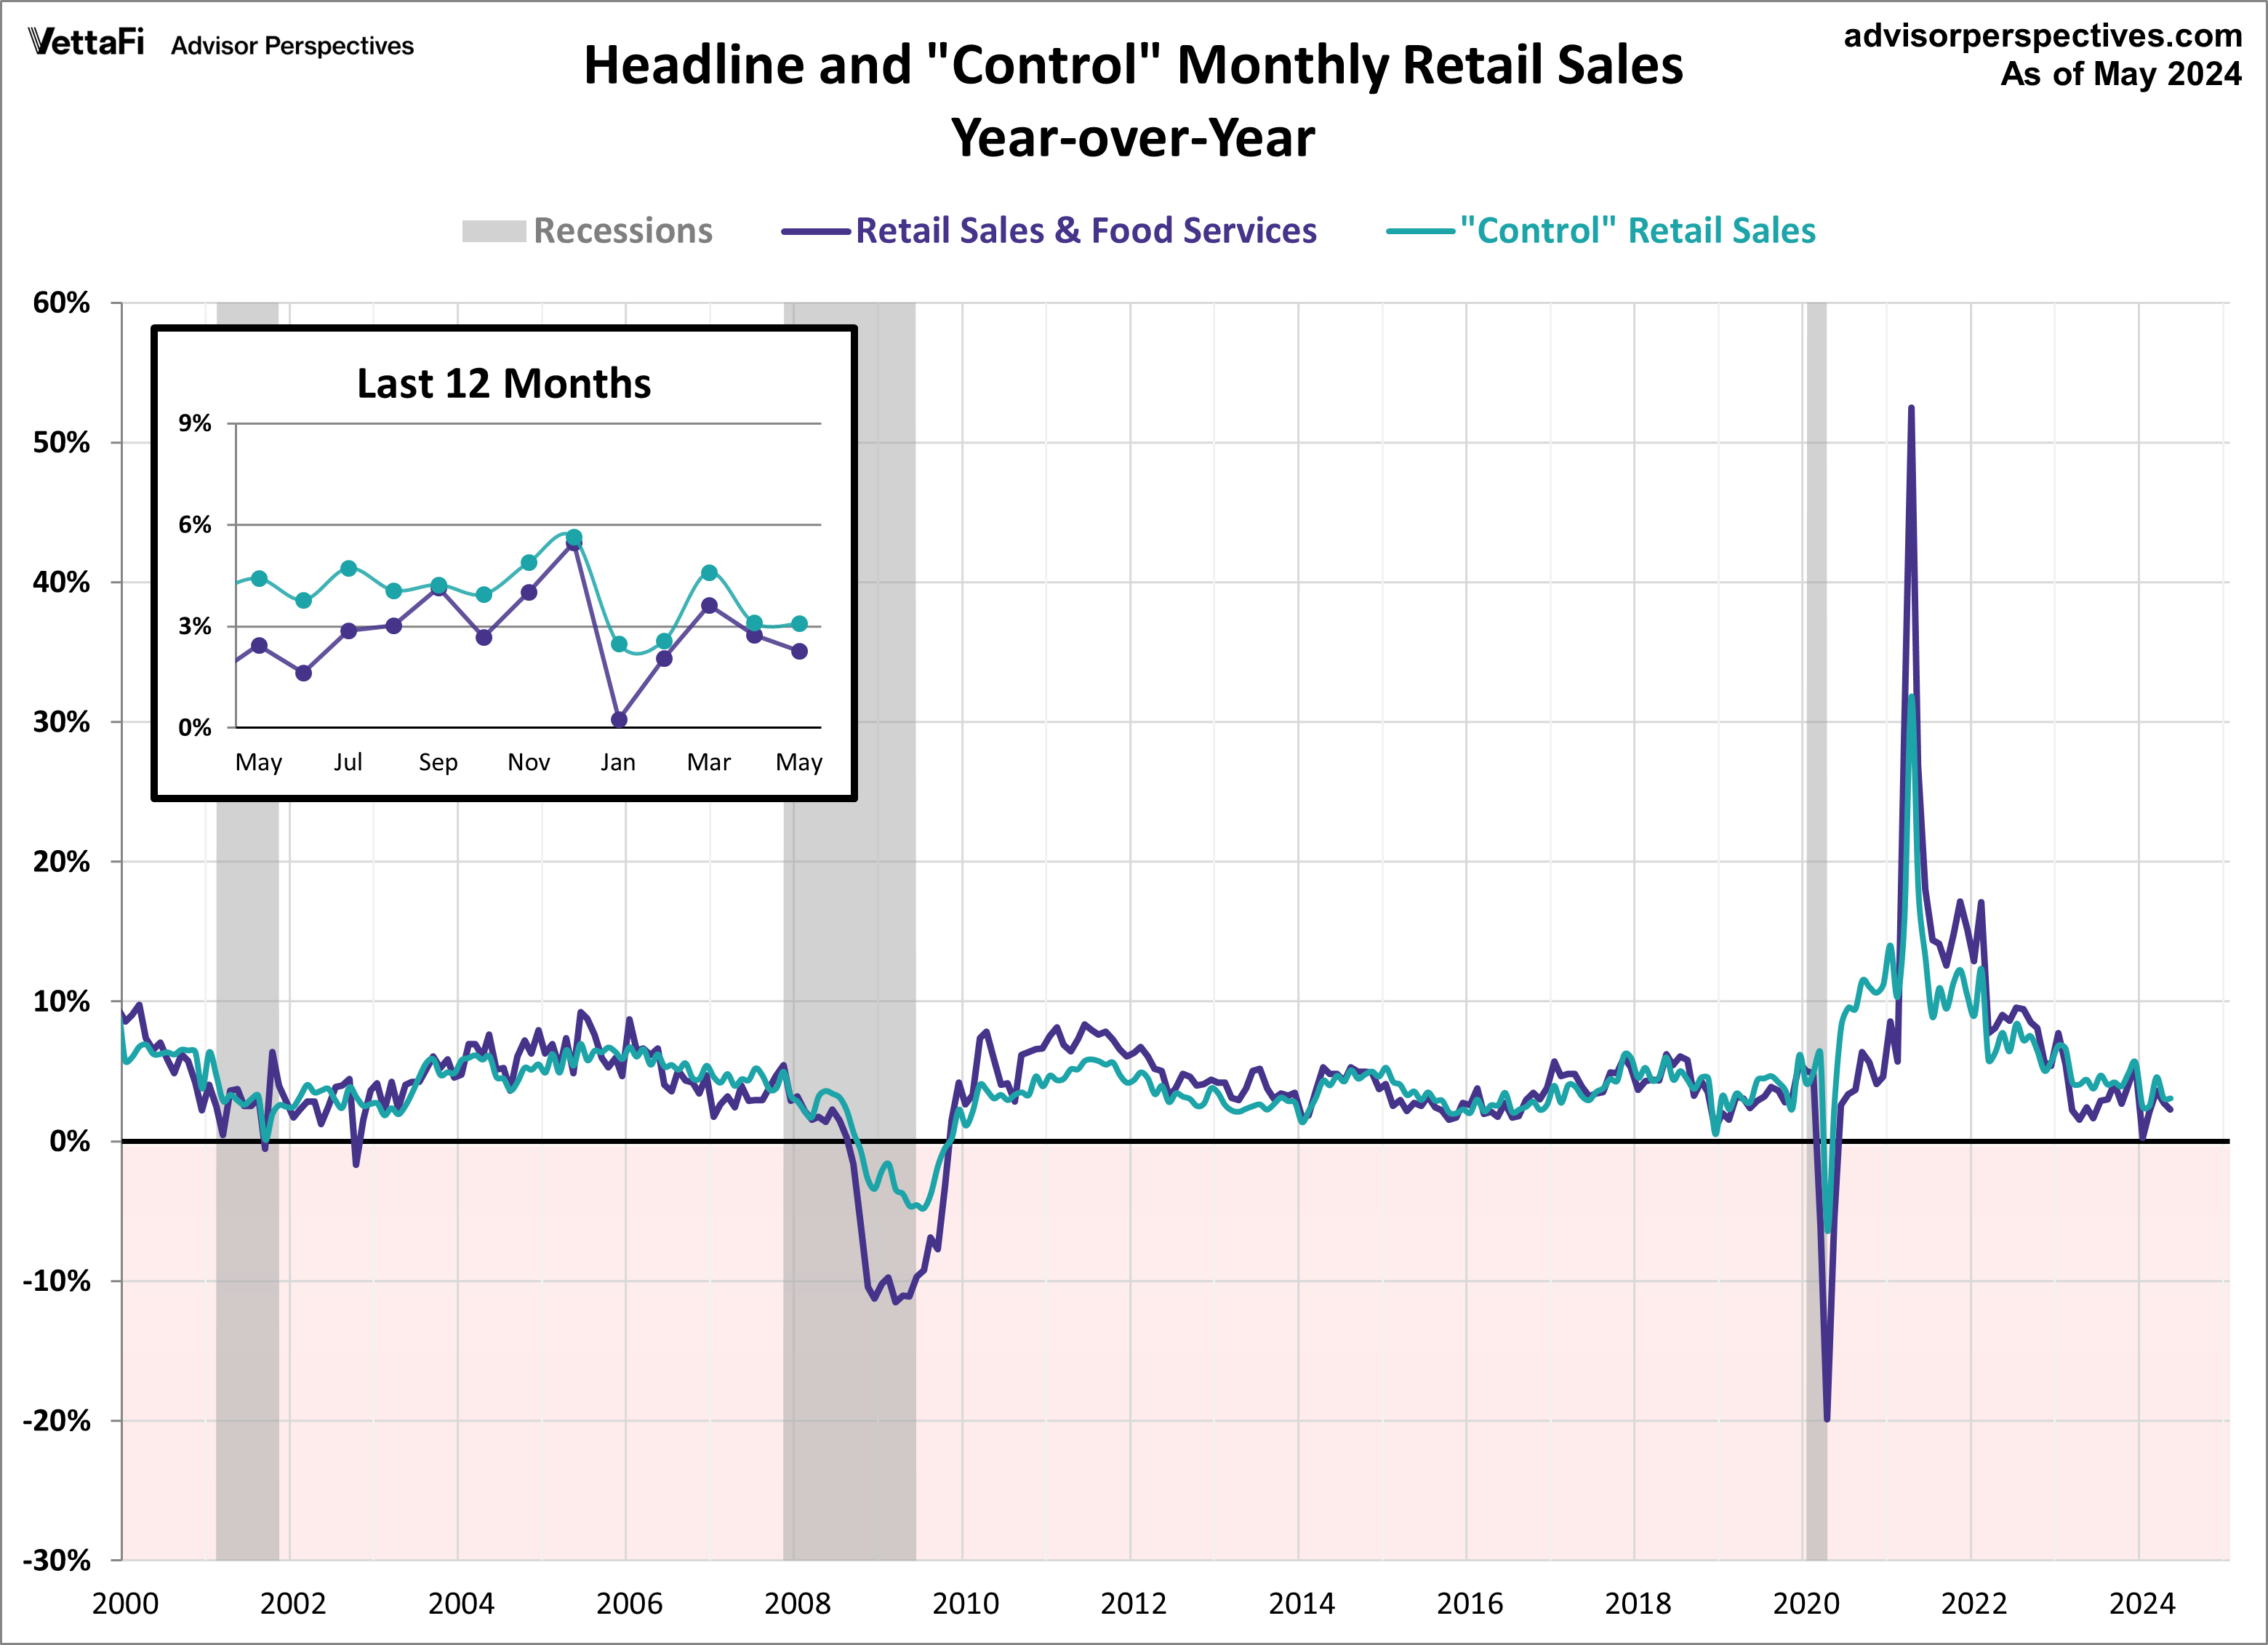
Here is the same series year-over-year. Current control purchases are up 3.1% compared to May 2023.
For a better sense of the reduced volatility of the “control” series, here is a YoY overlay with the headline retail sales. Note that the two series follow each other closely. But headline sales have more extreme highs and lows than the control series.
Retail sales will impact interest in the SPDR S&P Retail ETF (XRT), VanEck Retail ETF (RTH), Amplify Online Retail ETF (IBUY), and ProShares Online Retail ETF (ONLN).
For more news, information, and analysis, visit the Beyond Basic Beta Channel.